Immigrants from St. Vincent and the Grenadines vs Cape Verdean Vision Disability
COMPARE
Immigrants from St. Vincent and the Grenadines
Cape Verdean
Vision Disability
Vision Disability Comparison
Immigrants from St. Vincent and the Grenadines
Cape Verdeans
2.2%
VISION DISABILITY
30.3/ 100
METRIC RATING
187th/ 347
METRIC RANK
2.4%
VISION DISABILITY
0.0/ 100
METRIC RATING
280th/ 347
METRIC RANK
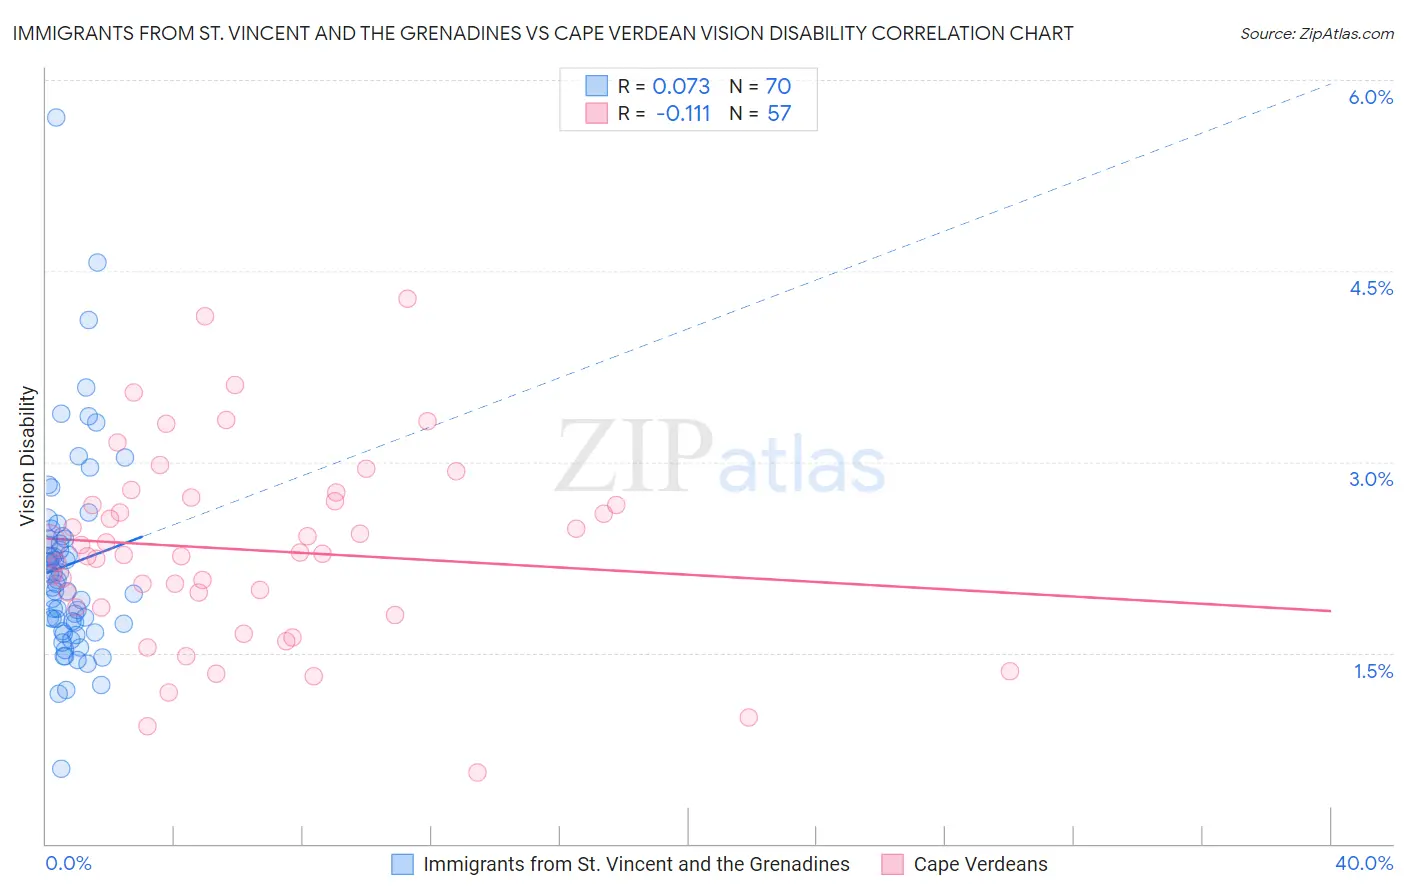
Immigrants from St. Vincent and the Grenadines vs Cape Verdean Vision Disability Correlation Chart
The statistical analysis conducted on geographies consisting of 56,186,719 people shows a slight positive correlation between the proportion of Immigrants from St. Vincent and the Grenadines and percentage of population with vision disability in the United States with a correlation coefficient (R) of 0.073 and weighted average of 2.2%. Similarly, the statistical analysis conducted on geographies consisting of 107,539,896 people shows a poor negative correlation between the proportion of Cape Verdeans and percentage of population with vision disability in the United States with a correlation coefficient (R) of -0.111 and weighted average of 2.4%, a difference of 11.5%.
Vision Disability Correlation Summary
| Measurement | Immigrants from St. Vincent and the Grenadines | Cape Verdean |
| Minimum | 0.59% | 0.56% |
| Maximum | 5.7% | 4.3% |
| Range | 5.1% | 3.7% |
| Mean | 2.2% | 2.3% |
| Median | 2.1% | 2.3% |
| Interquartile 25% (IQ1) | 1.7% | 1.9% |
| Interquartile 75% (IQ3) | 2.4% | 2.7% |
| Interquartile Range (IQR) | 0.67% | 0.84% |
| Standard Deviation (Sample) | 0.80% | 0.75% |
| Standard Deviation (Population) | 0.79% | 0.74% |
Similar Demographics by Vision Disability
Demographics Similar to Immigrants from St. Vincent and the Grenadines by Vision Disability
In terms of vision disability, the demographic groups most similar to Immigrants from St. Vincent and the Grenadines are Guyanese (2.2%, a difference of 0.11%), Salvadoran (2.2%, a difference of 0.21%), Native Hawaiian (2.2%, a difference of 0.22%), Immigrants from Middle Africa (2.2%, a difference of 0.23%), and Immigrants from Costa Rica (2.2%, a difference of 0.32%).
| Demographics | Rating | Rank | Vision Disability |
| Uruguayans | 42.7 /100 | #180 | Average 2.2% |
| Immigrants | Western Europe | 41.1 /100 | #181 | Average 2.2% |
| Costa Ricans | 40.7 /100 | #182 | Average 2.2% |
| Immigrants | Burma/Myanmar | 37.9 /100 | #183 | Fair 2.2% |
| Moroccans | 35.4 /100 | #184 | Fair 2.2% |
| Immigrants | Middle Africa | 33.5 /100 | #185 | Fair 2.2% |
| Native Hawaiians | 33.3 /100 | #186 | Fair 2.2% |
| Immigrants | St. Vincent and the Grenadines | 30.3 /100 | #187 | Fair 2.2% |
| Guyanese | 28.9 /100 | #188 | Fair 2.2% |
| Salvadorans | 27.4 /100 | #189 | Fair 2.2% |
| Immigrants | Costa Rica | 26.1 /100 | #190 | Fair 2.2% |
| Canadians | 25.8 /100 | #191 | Fair 2.2% |
| Europeans | 25.7 /100 | #192 | Fair 2.2% |
| British | 25.1 /100 | #193 | Fair 2.2% |
| Immigrants | Barbados | 24.0 /100 | #194 | Fair 2.2% |
Demographics Similar to Cape Verdeans by Vision Disability
In terms of vision disability, the demographic groups most similar to Cape Verdeans are Nepalese (2.4%, a difference of 0.040%), Spanish (2.4%, a difference of 0.050%), Bahamian (2.4%, a difference of 0.21%), U.S. Virgin Islander (2.5%, a difference of 0.23%), and Scotch-Irish (2.4%, a difference of 0.25%).
| Demographics | Rating | Rank | Vision Disability |
| Immigrants | Bahamas | 0.1 /100 | #273 | Tragic 2.4% |
| Immigrants | Latin America | 0.0 /100 | #274 | Tragic 2.4% |
| Chippewa | 0.0 /100 | #275 | Tragic 2.4% |
| Scotch-Irish | 0.0 /100 | #276 | Tragic 2.4% |
| Bahamians | 0.0 /100 | #277 | Tragic 2.4% |
| Spanish | 0.0 /100 | #278 | Tragic 2.4% |
| Nepalese | 0.0 /100 | #279 | Tragic 2.4% |
| Cape Verdeans | 0.0 /100 | #280 | Tragic 2.4% |
| U.S. Virgin Islanders | 0.0 /100 | #281 | Tragic 2.5% |
| Immigrants | Caribbean | 0.0 /100 | #282 | Tragic 2.5% |
| Puget Sound Salish | 0.0 /100 | #283 | Tragic 2.5% |
| Yakama | 0.0 /100 | #284 | Tragic 2.5% |
| Immigrants | Central America | 0.0 /100 | #285 | Tragic 2.5% |
| Sioux | 0.0 /100 | #286 | Tragic 2.5% |
| Hondurans | 0.0 /100 | #287 | Tragic 2.5% |