Kiowa vs Cape Verdean Vision Disability
COMPARE
Kiowa
Cape Verdean
Vision Disability
Vision Disability Comparison
Kiowa
Cape Verdeans
3.3%
VISION DISABILITY
0.0/ 100
METRIC RATING
341st/ 347
METRIC RANK
2.4%
VISION DISABILITY
0.0/ 100
METRIC RATING
280th/ 347
METRIC RANK
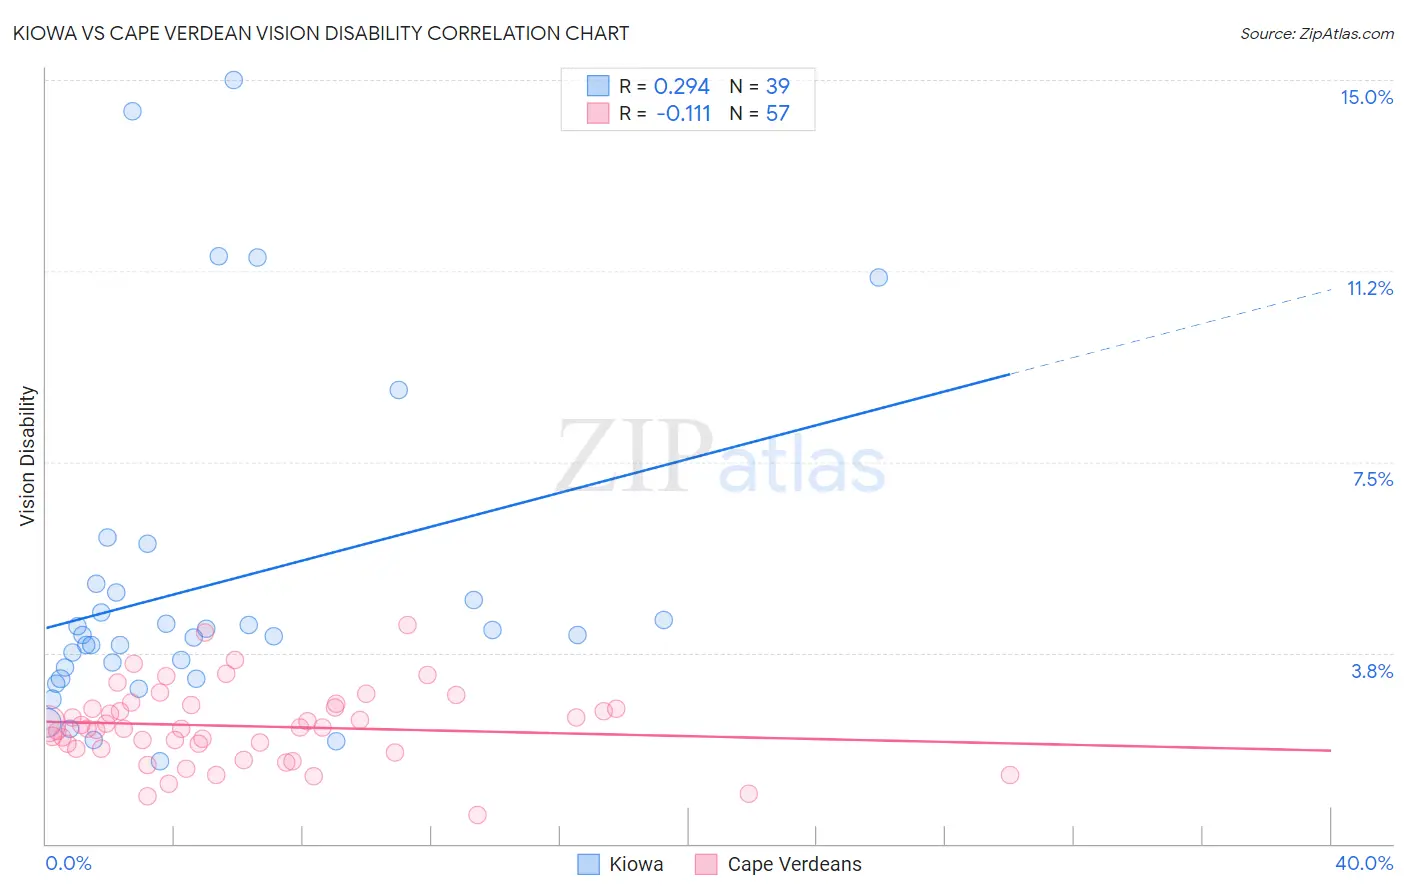
Kiowa vs Cape Verdean Vision Disability Correlation Chart
The statistical analysis conducted on geographies consisting of 56,085,396 people shows a weak positive correlation between the proportion of Kiowa and percentage of population with vision disability in the United States with a correlation coefficient (R) of 0.294 and weighted average of 3.3%. Similarly, the statistical analysis conducted on geographies consisting of 107,539,896 people shows a poor negative correlation between the proportion of Cape Verdeans and percentage of population with vision disability in the United States with a correlation coefficient (R) of -0.111 and weighted average of 2.4%, a difference of 32.9%.
Vision Disability Correlation Summary
| Measurement | Kiowa | Cape Verdean |
| Minimum | 1.6% | 0.56% |
| Maximum | 15.0% | 4.3% |
| Range | 13.4% | 3.7% |
| Mean | 5.1% | 2.3% |
| Median | 4.1% | 2.3% |
| Interquartile 25% (IQ1) | 3.2% | 1.9% |
| Interquartile 75% (IQ3) | 4.9% | 2.7% |
| Interquartile Range (IQR) | 1.7% | 0.84% |
| Standard Deviation (Sample) | 3.3% | 0.75% |
| Standard Deviation (Population) | 3.2% | 0.74% |
Similar Demographics by Vision Disability
Demographics Similar to Kiowa by Vision Disability
In terms of vision disability, the demographic groups most similar to Kiowa are Choctaw (3.3%, a difference of 1.4%), Creek (3.2%, a difference of 1.4%), Tsimshian (3.2%, a difference of 1.6%), Chickasaw (3.2%, a difference of 2.3%), and Pima (3.3%, a difference of 2.5%).
| Demographics | Rating | Rank | Vision Disability |
| Cajuns | 0.0 /100 | #333 | Tragic 3.1% |
| Cheyenne | 0.0 /100 | #334 | Tragic 3.1% |
| Navajo | 0.0 /100 | #335 | Tragic 3.1% |
| Alaskan Athabascans | 0.0 /100 | #336 | Tragic 3.1% |
| Dutch West Indians | 0.0 /100 | #337 | Tragic 3.2% |
| Chickasaw | 0.0 /100 | #338 | Tragic 3.2% |
| Tsimshian | 0.0 /100 | #339 | Tragic 3.2% |
| Creek | 0.0 /100 | #340 | Tragic 3.2% |
| Kiowa | 0.0 /100 | #341 | Tragic 3.3% |
| Choctaw | 0.0 /100 | #342 | Tragic 3.3% |
| Pima | 0.0 /100 | #343 | Tragic 3.3% |
| Pueblo | 0.0 /100 | #344 | Tragic 3.3% |
| Lumbee | 0.0 /100 | #345 | Tragic 3.4% |
| Houma | 0.0 /100 | #346 | Tragic 3.4% |
| Puerto Ricans | 0.0 /100 | #347 | Tragic 3.9% |
Demographics Similar to Cape Verdeans by Vision Disability
In terms of vision disability, the demographic groups most similar to Cape Verdeans are Nepalese (2.4%, a difference of 0.040%), Spanish (2.4%, a difference of 0.050%), Bahamian (2.4%, a difference of 0.21%), U.S. Virgin Islander (2.5%, a difference of 0.23%), and Scotch-Irish (2.4%, a difference of 0.25%).
| Demographics | Rating | Rank | Vision Disability |
| Immigrants | Bahamas | 0.1 /100 | #273 | Tragic 2.4% |
| Immigrants | Latin America | 0.0 /100 | #274 | Tragic 2.4% |
| Chippewa | 0.0 /100 | #275 | Tragic 2.4% |
| Scotch-Irish | 0.0 /100 | #276 | Tragic 2.4% |
| Bahamians | 0.0 /100 | #277 | Tragic 2.4% |
| Spanish | 0.0 /100 | #278 | Tragic 2.4% |
| Nepalese | 0.0 /100 | #279 | Tragic 2.4% |
| Cape Verdeans | 0.0 /100 | #280 | Tragic 2.4% |
| U.S. Virgin Islanders | 0.0 /100 | #281 | Tragic 2.5% |
| Immigrants | Caribbean | 0.0 /100 | #282 | Tragic 2.5% |
| Puget Sound Salish | 0.0 /100 | #283 | Tragic 2.5% |
| Yakama | 0.0 /100 | #284 | Tragic 2.5% |
| Immigrants | Central America | 0.0 /100 | #285 | Tragic 2.5% |
| Sioux | 0.0 /100 | #286 | Tragic 2.5% |
| Hondurans | 0.0 /100 | #287 | Tragic 2.5% |