Immigrants from Ireland vs Cape Verdean Vision Disability
COMPARE
Immigrants from Ireland
Cape Verdean
Vision Disability
Vision Disability Comparison
Immigrants from Ireland
Cape Verdeans
2.0%
VISION DISABILITY
99.7/ 100
METRIC RATING
40th/ 347
METRIC RANK
2.4%
VISION DISABILITY
0.0/ 100
METRIC RATING
280th/ 347
METRIC RANK
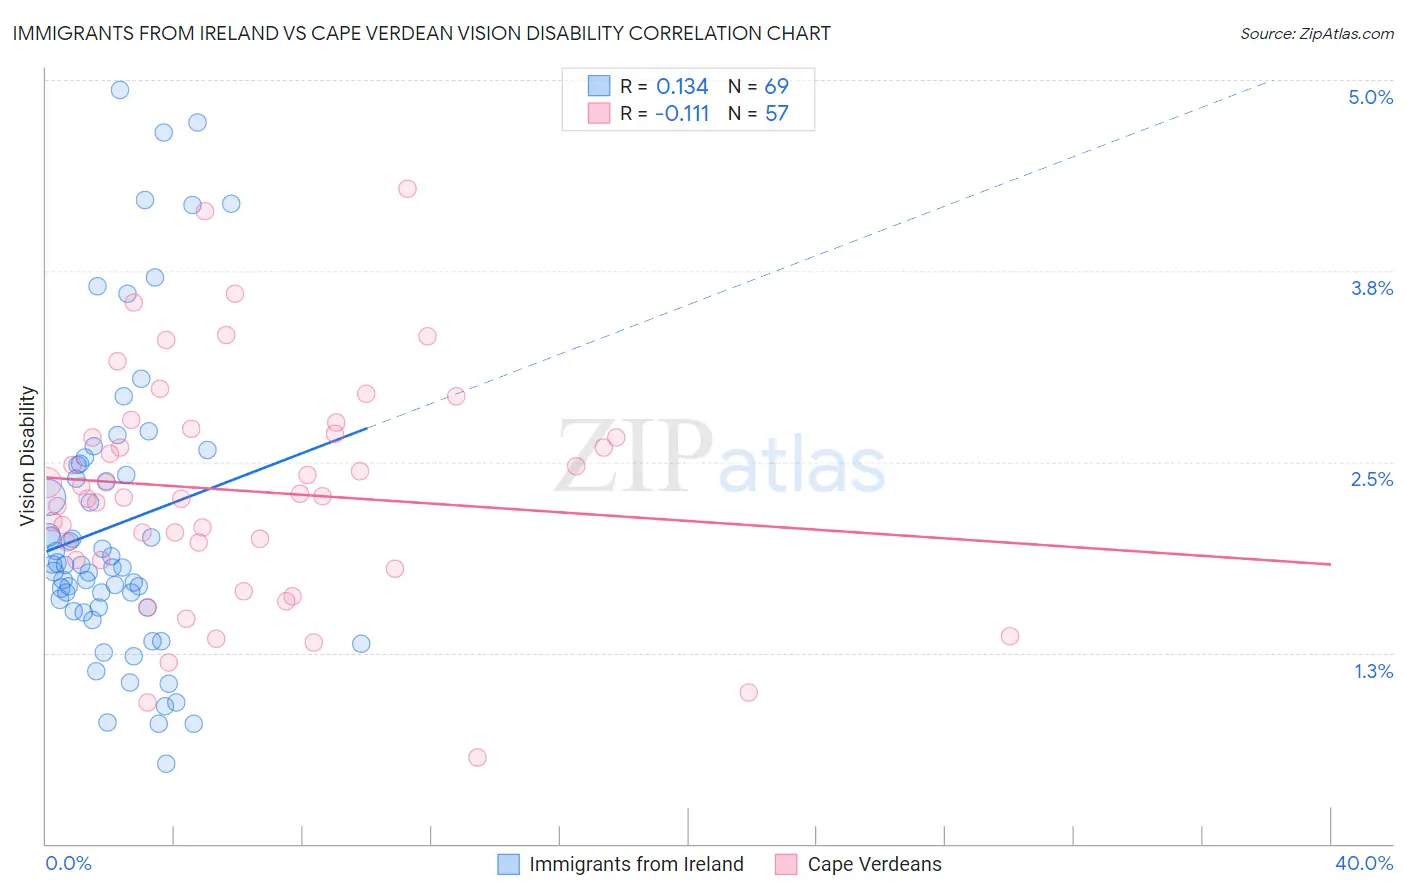
Immigrants from Ireland vs Cape Verdean Vision Disability Correlation Chart
The statistical analysis conducted on geographies consisting of 240,640,938 people shows a poor positive correlation between the proportion of Immigrants from Ireland and percentage of population with vision disability in the United States with a correlation coefficient (R) of 0.134 and weighted average of 2.0%. Similarly, the statistical analysis conducted on geographies consisting of 107,539,896 people shows a poor negative correlation between the proportion of Cape Verdeans and percentage of population with vision disability in the United States with a correlation coefficient (R) of -0.111 and weighted average of 2.4%, a difference of 24.4%.
Vision Disability Correlation Summary
| Measurement | Immigrants from Ireland | Cape Verdean |
| Minimum | 0.52% | 0.56% |
| Maximum | 4.9% | 4.3% |
| Range | 4.4% | 3.7% |
| Mean | 2.1% | 2.3% |
| Median | 1.8% | 2.3% |
| Interquartile 25% (IQ1) | 1.5% | 1.9% |
| Interquartile 75% (IQ3) | 2.5% | 2.7% |
| Interquartile Range (IQR) | 0.95% | 0.84% |
| Standard Deviation (Sample) | 0.99% | 0.75% |
| Standard Deviation (Population) | 0.98% | 0.74% |
Similar Demographics by Vision Disability
Demographics Similar to Immigrants from Ireland by Vision Disability
In terms of vision disability, the demographic groups most similar to Immigrants from Ireland are Cypriot (2.0%, a difference of 0.030%), Immigrants from Ethiopia (2.0%, a difference of 0.18%), Zimbabwean (2.0%, a difference of 0.20%), Eastern European (2.0%, a difference of 0.24%), and Immigrants from Kuwait (2.0%, a difference of 0.26%).
| Demographics | Rating | Rank | Vision Disability |
| Immigrants | Egypt | 99.9 /100 | #33 | Exceptional 1.9% |
| Immigrants | Turkey | 99.8 /100 | #34 | Exceptional 1.9% |
| Immigrants | Australia | 99.8 /100 | #35 | Exceptional 1.9% |
| Cambodians | 99.8 /100 | #36 | Exceptional 2.0% |
| Bhutanese | 99.8 /100 | #37 | Exceptional 2.0% |
| Immigrants | Kuwait | 99.8 /100 | #38 | Exceptional 2.0% |
| Zimbabweans | 99.7 /100 | #39 | Exceptional 2.0% |
| Immigrants | Ireland | 99.7 /100 | #40 | Exceptional 2.0% |
| Cypriots | 99.7 /100 | #41 | Exceptional 2.0% |
| Immigrants | Ethiopia | 99.7 /100 | #42 | Exceptional 2.0% |
| Eastern Europeans | 99.7 /100 | #43 | Exceptional 2.0% |
| Immigrants | Indonesia | 99.7 /100 | #44 | Exceptional 2.0% |
| Ethiopians | 99.7 /100 | #45 | Exceptional 2.0% |
| Immigrants | Sweden | 99.7 /100 | #46 | Exceptional 2.0% |
| Immigrants | Bulgaria | 99.7 /100 | #47 | Exceptional 2.0% |
Demographics Similar to Cape Verdeans by Vision Disability
In terms of vision disability, the demographic groups most similar to Cape Verdeans are Nepalese (2.4%, a difference of 0.040%), Spanish (2.4%, a difference of 0.050%), Bahamian (2.4%, a difference of 0.21%), U.S. Virgin Islander (2.5%, a difference of 0.23%), and Scotch-Irish (2.4%, a difference of 0.25%).
| Demographics | Rating | Rank | Vision Disability |
| Immigrants | Bahamas | 0.1 /100 | #273 | Tragic 2.4% |
| Immigrants | Latin America | 0.0 /100 | #274 | Tragic 2.4% |
| Chippewa | 0.0 /100 | #275 | Tragic 2.4% |
| Scotch-Irish | 0.0 /100 | #276 | Tragic 2.4% |
| Bahamians | 0.0 /100 | #277 | Tragic 2.4% |
| Spanish | 0.0 /100 | #278 | Tragic 2.4% |
| Nepalese | 0.0 /100 | #279 | Tragic 2.4% |
| Cape Verdeans | 0.0 /100 | #280 | Tragic 2.4% |
| U.S. Virgin Islanders | 0.0 /100 | #281 | Tragic 2.5% |
| Immigrants | Caribbean | 0.0 /100 | #282 | Tragic 2.5% |
| Puget Sound Salish | 0.0 /100 | #283 | Tragic 2.5% |
| Yakama | 0.0 /100 | #284 | Tragic 2.5% |
| Immigrants | Central America | 0.0 /100 | #285 | Tragic 2.5% |
| Sioux | 0.0 /100 | #286 | Tragic 2.5% |
| Hondurans | 0.0 /100 | #287 | Tragic 2.5% |