Slovene vs Canadian Disability Age Under 5
COMPARE
Slovene
Canadian
Disability Age Under 5
Disability Age Under 5 Comparison
Slovenes
Canadians
1.4%
DISABILITY AGE UNDER 5
0.3/ 100
METRIC RATING
257th/ 347
METRIC RANK
1.5%
DISABILITY AGE UNDER 5
0.0/ 100
METRIC RATING
277th/ 347
METRIC RANK
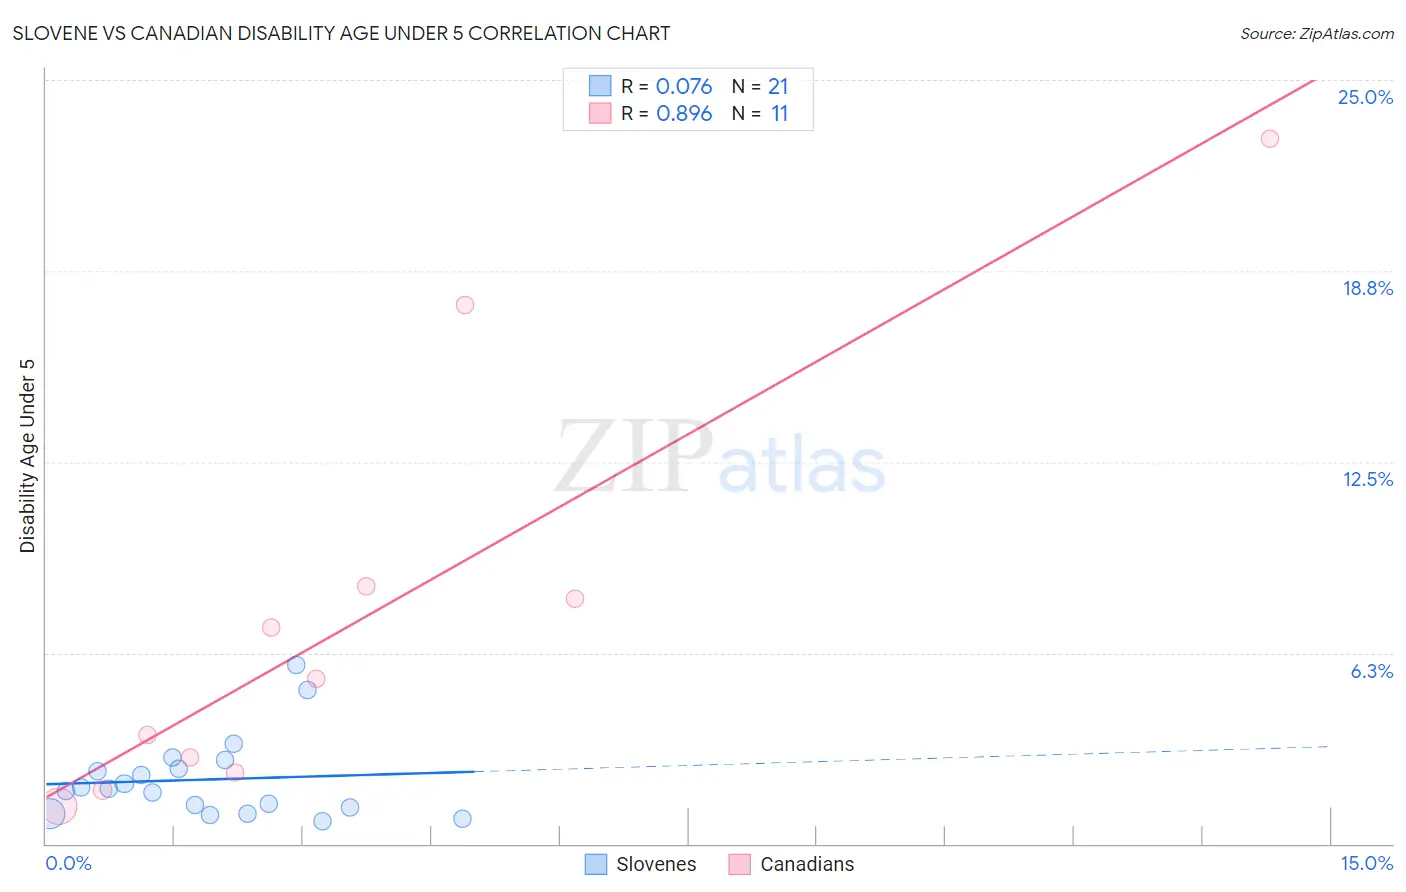
Slovene vs Canadian Disability Age Under 5 Correlation Chart
The statistical analysis conducted on geographies consisting of 155,245,072 people shows a slight positive correlation between the proportion of Slovenes and percentage of population with a disability under the age of 5 in the United States with a correlation coefficient (R) of 0.076 and weighted average of 1.4%. Similarly, the statistical analysis conducted on geographies consisting of 226,239,251 people shows a very strong positive correlation between the proportion of Canadians and percentage of population with a disability under the age of 5 in the United States with a correlation coefficient (R) of 0.896 and weighted average of 1.5%, a difference of 5.3%.
Disability Age Under 5 Correlation Summary
| Measurement | Slovene | Canadian |
| Minimum | 0.73% | 1.2% |
| Maximum | 5.9% | 23.1% |
| Range | 5.1% | 21.8% |
| Mean | 2.1% | 7.4% |
| Median | 1.8% | 5.4% |
| Interquartile 25% (IQ1) | 1.1% | 2.3% |
| Interquartile 75% (IQ3) | 2.6% | 8.4% |
| Interquartile Range (IQR) | 1.5% | 6.1% |
| Standard Deviation (Sample) | 1.3% | 7.0% |
| Standard Deviation (Population) | 1.3% | 6.7% |
Demographics Similar to Slovenes and Canadians by Disability Age Under 5
In terms of disability age under 5, the demographic groups most similar to Slovenes are Costa Rican (1.4%, a difference of 0.19%), Immigrants from Southern Europe (1.4%, a difference of 0.34%), Slavic (1.4%, a difference of 0.55%), Immigrants from Netherlands (1.4%, a difference of 1.2%), and Immigrants from Dominica (1.4%, a difference of 1.4%). Similarly, the demographic groups most similar to Canadians are Greek (1.5%, a difference of 0.70%), Brazilian (1.5%, a difference of 1.3%), Iroquois (1.5%, a difference of 1.4%), Alaskan Athabascan (1.5%, a difference of 1.7%), and Black/African American (1.4%, a difference of 2.0%).
| Demographics | Rating | Rank | Disability Age Under 5 |
| Slovenes | 0.3 /100 | #257 | Tragic 1.4% |
| Costa Ricans | 0.3 /100 | #258 | Tragic 1.4% |
| Immigrants | Southern Europe | 0.3 /100 | #259 | Tragic 1.4% |
| Slavs | 0.3 /100 | #260 | Tragic 1.4% |
| Immigrants | Netherlands | 0.2 /100 | #261 | Tragic 1.4% |
| Immigrants | Dominica | 0.2 /100 | #262 | Tragic 1.4% |
| Spanish | 0.2 /100 | #263 | Tragic 1.4% |
| Yugoslavians | 0.1 /100 | #264 | Tragic 1.4% |
| Carpatho Rusyns | 0.1 /100 | #265 | Tragic 1.4% |
| Immigrants | Germany | 0.1 /100 | #266 | Tragic 1.4% |
| Cree | 0.1 /100 | #267 | Tragic 1.4% |
| Belgians | 0.1 /100 | #268 | Tragic 1.4% |
| Austrians | 0.1 /100 | #269 | Tragic 1.4% |
| Immigrants | North America | 0.1 /100 | #270 | Tragic 1.4% |
| Immigrants | Canada | 0.1 /100 | #271 | Tragic 1.4% |
| Blacks/African Americans | 0.1 /100 | #272 | Tragic 1.4% |
| Alaskan Athabascans | 0.1 /100 | #273 | Tragic 1.5% |
| Iroquois | 0.0 /100 | #274 | Tragic 1.5% |
| Brazilians | 0.0 /100 | #275 | Tragic 1.5% |
| Greeks | 0.0 /100 | #276 | Tragic 1.5% |
| Canadians | 0.0 /100 | #277 | Tragic 1.5% |