Macedonian vs Bulgarian Disability Age Over 75
COMPARE
Macedonian
Bulgarian
Disability Age Over 75
Disability Age Over 75 Comparison
Macedonians
Bulgarians
45.4%
DISABILITY AGE OVER 75
99.9/ 100
METRIC RATING
26th/ 347
METRIC RANK
45.1%
DISABILITY AGE OVER 75
100.0/ 100
METRIC RATING
10th/ 347
METRIC RANK
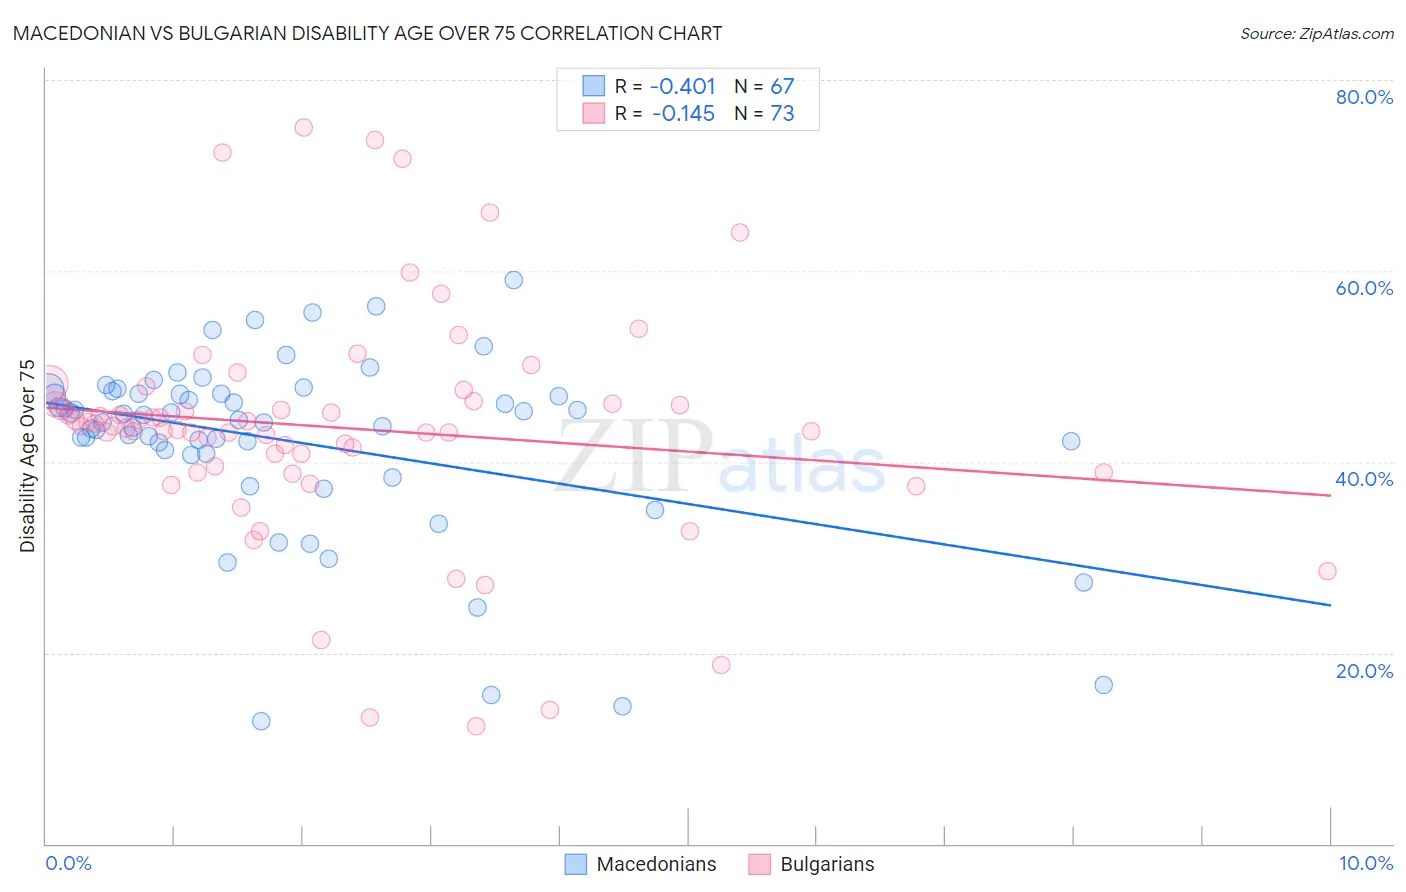
Macedonian vs Bulgarian Disability Age Over 75 Correlation Chart
The statistical analysis conducted on geographies consisting of 132,585,926 people shows a moderate negative correlation between the proportion of Macedonians and percentage of population with a disability over the age of 75 in the United States with a correlation coefficient (R) of -0.401 and weighted average of 45.4%. Similarly, the statistical analysis conducted on geographies consisting of 205,489,445 people shows a poor negative correlation between the proportion of Bulgarians and percentage of population with a disability over the age of 75 in the United States with a correlation coefficient (R) of -0.145 and weighted average of 45.1%, a difference of 0.74%.
Disability Age Over 75 Correlation Summary
| Measurement | Macedonian | Bulgarian |
| Minimum | 12.8% | 12.4% |
| Maximum | 59.0% | 75.0% |
| Range | 46.2% | 62.6% |
| Mean | 42.2% | 43.6% |
| Median | 44.3% | 43.7% |
| Interquartile 25% (IQ1) | 40.9% | 39.2% |
| Interquartile 75% (IQ3) | 47.1% | 46.3% |
| Interquartile Range (IQR) | 6.2% | 7.1% |
| Standard Deviation (Sample) | 9.5% | 12.2% |
| Standard Deviation (Population) | 9.5% | 12.1% |
Demographics Similar to Macedonians and Bulgarians by Disability Age Over 75
In terms of disability age over 75, the demographic groups most similar to Macedonians are Immigrants from Poland (45.4%, a difference of 0.010%), Immigrants from Bolivia (45.4%, a difference of 0.040%), Thai (45.4%, a difference of 0.040%), Polish (45.3%, a difference of 0.080%), and Immigrants from Switzerland (45.3%, a difference of 0.10%). Similarly, the demographic groups most similar to Bulgarians are Lithuanian (45.1%, a difference of 0.050%), Immigrants from Czechoslovakia (45.1%, a difference of 0.14%), Latvian (45.1%, a difference of 0.15%), Paraguayan (45.0%, a difference of 0.16%), and Immigrants from Scotland (45.1%, a difference of 0.16%).
| Demographics | Rating | Rank | Disability Age Over 75 |
| Immigrants | Austria | 100.0 /100 | #8 | Exceptional 44.9% |
| Paraguayans | 100.0 /100 | #9 | Exceptional 45.0% |
| Bulgarians | 100.0 /100 | #10 | Exceptional 45.1% |
| Lithuanians | 100.0 /100 | #11 | Exceptional 45.1% |
| Immigrants | Czechoslovakia | 100.0 /100 | #12 | Exceptional 45.1% |
| Latvians | 100.0 /100 | #13 | Exceptional 45.1% |
| Immigrants | Scotland | 100.0 /100 | #14 | Exceptional 45.1% |
| Immigrants | Sweden | 100.0 /100 | #15 | Exceptional 45.1% |
| Immigrants | Northern Europe | 100.0 /100 | #16 | Exceptional 45.2% |
| Immigrants | India | 100.0 /100 | #17 | Exceptional 45.2% |
| Bolivians | 100.0 /100 | #18 | Exceptional 45.2% |
| Immigrants | Greece | 100.0 /100 | #19 | Exceptional 45.2% |
| Immigrants | Serbia | 100.0 /100 | #20 | Exceptional 45.3% |
| Immigrants | Belgium | 100.0 /100 | #21 | Exceptional 45.3% |
| Immigrants | South Africa | 100.0 /100 | #22 | Exceptional 45.3% |
| Immigrants | Switzerland | 99.9 /100 | #23 | Exceptional 45.3% |
| Poles | 99.9 /100 | #24 | Exceptional 45.3% |
| Immigrants | Bolivia | 99.9 /100 | #25 | Exceptional 45.4% |
| Macedonians | 99.9 /100 | #26 | Exceptional 45.4% |
| Immigrants | Poland | 99.9 /100 | #27 | Exceptional 45.4% |
| Thais | 99.9 /100 | #28 | Exceptional 45.4% |