Macedonian vs Immigrants from Jamaica Disability Age Over 75
COMPARE
Macedonian
Immigrants from Jamaica
Disability Age Over 75
Disability Age Over 75 Comparison
Macedonians
Immigrants from Jamaica
45.4%
DISABILITY AGE OVER 75
99.9/ 100
METRIC RATING
26th/ 347
METRIC RANK
47.6%
DISABILITY AGE OVER 75
28.3/ 100
METRIC RATING
192nd/ 347
METRIC RANK
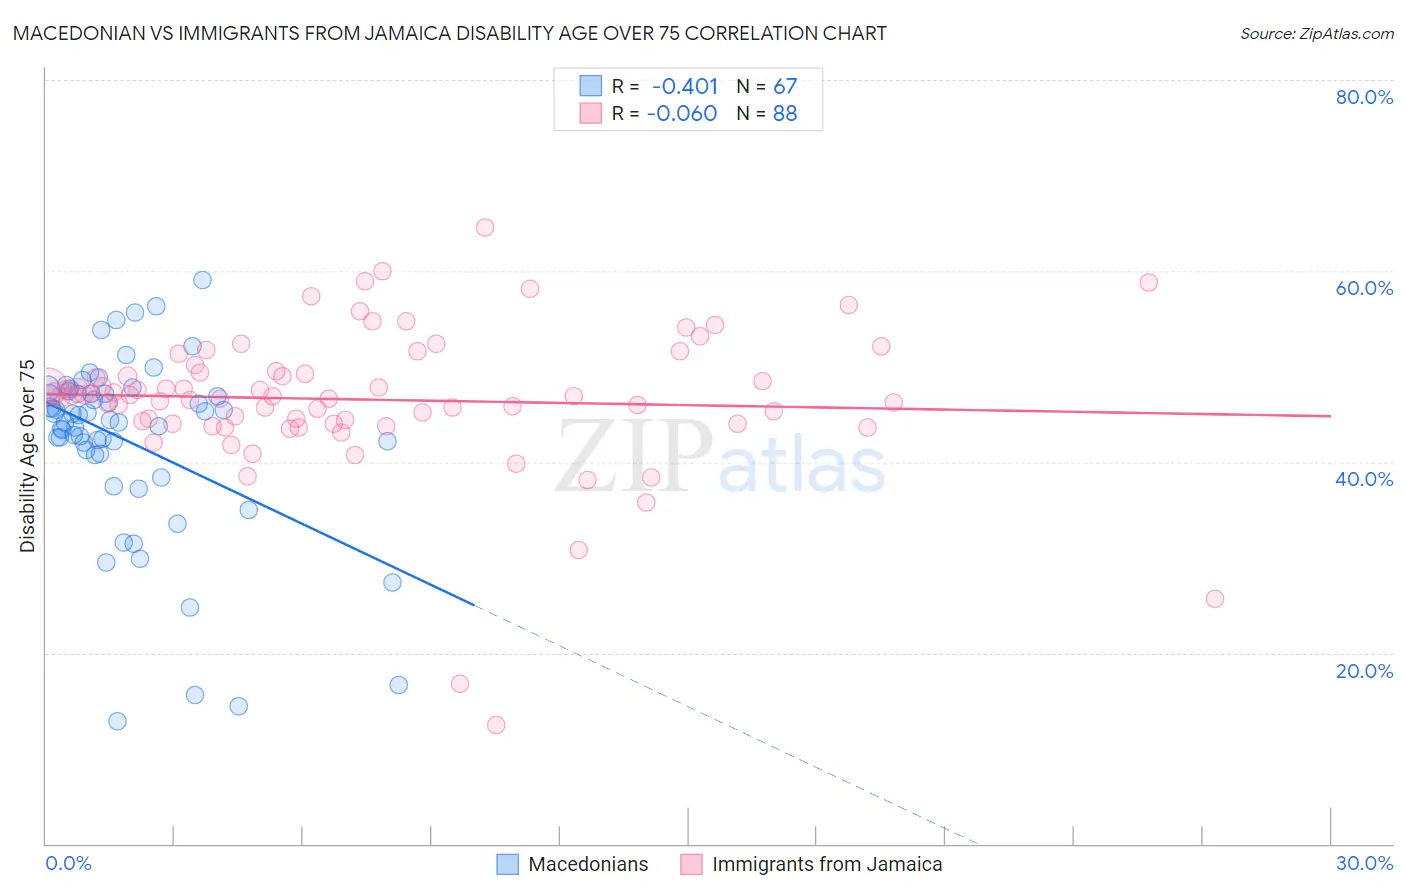
Macedonian vs Immigrants from Jamaica Disability Age Over 75 Correlation Chart
The statistical analysis conducted on geographies consisting of 132,585,926 people shows a moderate negative correlation between the proportion of Macedonians and percentage of population with a disability over the age of 75 in the United States with a correlation coefficient (R) of -0.401 and weighted average of 45.4%. Similarly, the statistical analysis conducted on geographies consisting of 301,075,213 people shows a slight negative correlation between the proportion of Immigrants from Jamaica and percentage of population with a disability over the age of 75 in the United States with a correlation coefficient (R) of -0.060 and weighted average of 47.6%, a difference of 4.9%.
Disability Age Over 75 Correlation Summary
| Measurement | Macedonian | Immigrants from Jamaica |
| Minimum | 12.8% | 12.5% |
| Maximum | 59.0% | 64.6% |
| Range | 46.2% | 52.1% |
| Mean | 42.2% | 46.5% |
| Median | 44.3% | 46.9% |
| Interquartile 25% (IQ1) | 40.9% | 44.1% |
| Interquartile 75% (IQ3) | 47.1% | 49.4% |
| Interquartile Range (IQR) | 6.2% | 5.4% |
| Standard Deviation (Sample) | 9.5% | 7.7% |
| Standard Deviation (Population) | 9.5% | 7.6% |
Similar Demographics by Disability Age Over 75
Demographics Similar to Macedonians by Disability Age Over 75
In terms of disability age over 75, the demographic groups most similar to Macedonians are Immigrants from Poland (45.4%, a difference of 0.010%), Immigrants from Bolivia (45.4%, a difference of 0.040%), Thai (45.4%, a difference of 0.040%), Polish (45.3%, a difference of 0.080%), and Filipino (45.4%, a difference of 0.080%).
| Demographics | Rating | Rank | Disability Age Over 75 |
| Immigrants | Greece | 100.0 /100 | #19 | Exceptional 45.2% |
| Immigrants | Serbia | 100.0 /100 | #20 | Exceptional 45.3% |
| Immigrants | Belgium | 100.0 /100 | #21 | Exceptional 45.3% |
| Immigrants | South Africa | 100.0 /100 | #22 | Exceptional 45.3% |
| Immigrants | Switzerland | 99.9 /100 | #23 | Exceptional 45.3% |
| Poles | 99.9 /100 | #24 | Exceptional 45.3% |
| Immigrants | Bolivia | 99.9 /100 | #25 | Exceptional 45.4% |
| Macedonians | 99.9 /100 | #26 | Exceptional 45.4% |
| Immigrants | Poland | 99.9 /100 | #27 | Exceptional 45.4% |
| Thais | 99.9 /100 | #28 | Exceptional 45.4% |
| Filipinos | 99.9 /100 | #29 | Exceptional 45.4% |
| Immigrants | Denmark | 99.9 /100 | #30 | Exceptional 45.4% |
| Immigrants | Bulgaria | 99.9 /100 | #31 | Exceptional 45.5% |
| Immigrants | Australia | 99.9 /100 | #32 | Exceptional 45.5% |
| Immigrants | Croatia | 99.9 /100 | #33 | Exceptional 45.5% |
Demographics Similar to Immigrants from Jamaica by Disability Age Over 75
In terms of disability age over 75, the demographic groups most similar to Immigrants from Jamaica are Ottawa (47.6%, a difference of 0.0%), Somali (47.6%, a difference of 0.030%), Portuguese (47.6%, a difference of 0.030%), Immigrants from Lebanon (47.6%, a difference of 0.050%), and Basque (47.6%, a difference of 0.070%).
| Demographics | Rating | Rank | Disability Age Over 75 |
| Ghanaians | 33.0 /100 | #185 | Fair 47.5% |
| Sudanese | 32.0 /100 | #186 | Fair 47.5% |
| Immigrants | Sudan | 31.8 /100 | #187 | Fair 47.5% |
| Basques | 30.9 /100 | #188 | Fair 47.6% |
| Immigrants | Kenya | 30.8 /100 | #189 | Fair 47.6% |
| Somalis | 29.5 /100 | #190 | Fair 47.6% |
| Portuguese | 29.3 /100 | #191 | Fair 47.6% |
| Immigrants | Jamaica | 28.3 /100 | #192 | Fair 47.6% |
| Ottawa | 28.1 /100 | #193 | Fair 47.6% |
| Immigrants | Lebanon | 26.5 /100 | #194 | Fair 47.6% |
| Immigrants | Trinidad and Tobago | 25.3 /100 | #195 | Fair 47.6% |
| Immigrants | Portugal | 23.8 /100 | #196 | Fair 47.6% |
| Pakistanis | 23.4 /100 | #197 | Fair 47.7% |
| Immigrants | Ukraine | 23.2 /100 | #198 | Fair 47.7% |
| Immigrants | Eritrea | 22.4 /100 | #199 | Fair 47.7% |