Spanish American vs Palestinian Male Disability
COMPARE
Spanish American
Palestinian
Male Disability
Male Disability Comparison
Spanish Americans
Palestinians
13.3%
MALE DISABILITY
0.0/ 100
METRIC RATING
306th/ 347
METRIC RANK
10.7%
MALE DISABILITY
97.4/ 100
METRIC RATING
92nd/ 347
METRIC RANK
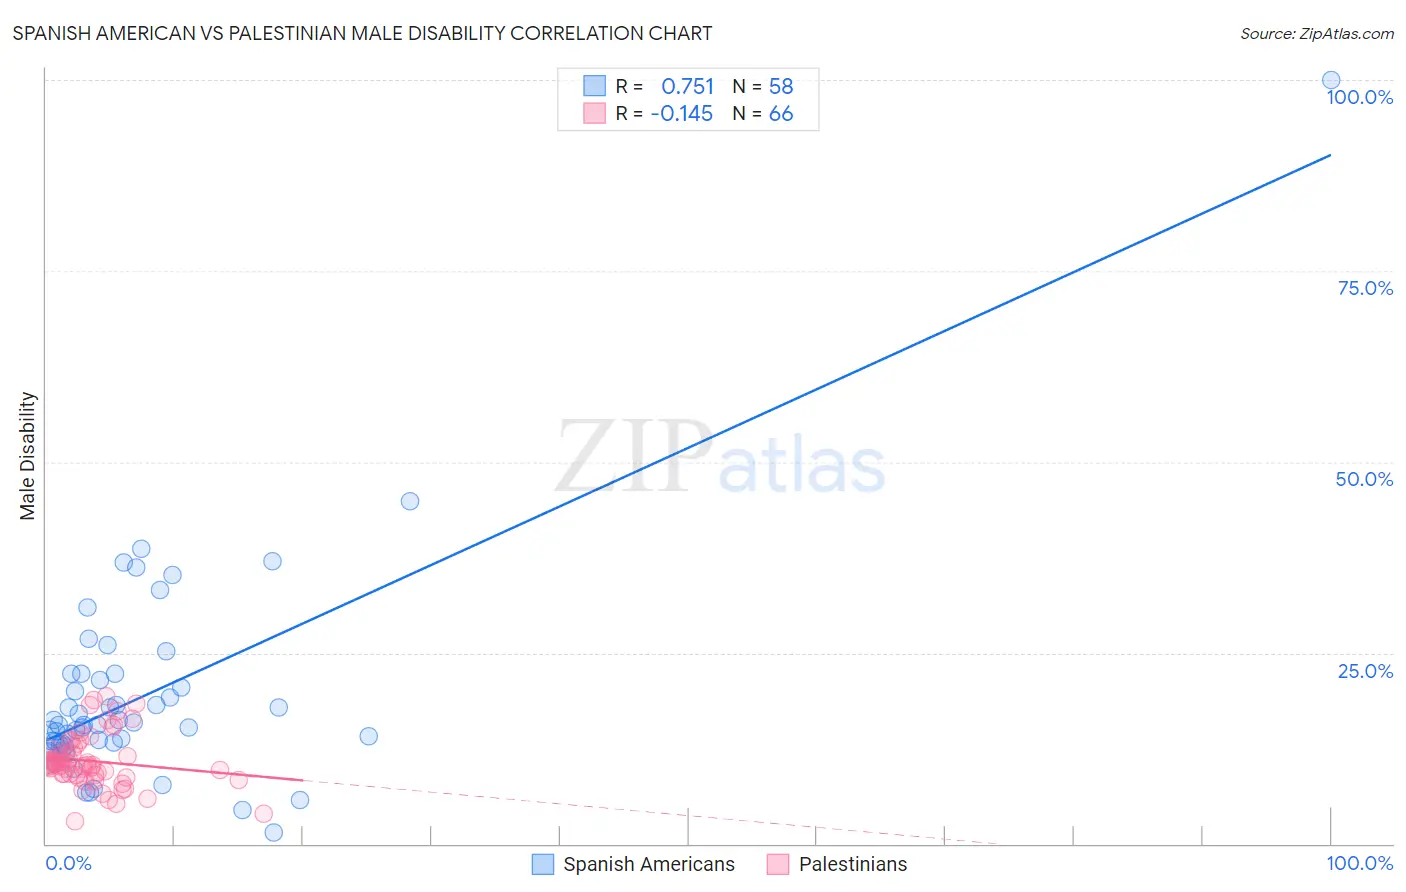
Spanish American vs Palestinian Male Disability Correlation Chart
The statistical analysis conducted on geographies consisting of 103,168,245 people shows a strong positive correlation between the proportion of Spanish Americans and percentage of males with a disability in the United States with a correlation coefficient (R) of 0.751 and weighted average of 13.3%. Similarly, the statistical analysis conducted on geographies consisting of 216,464,245 people shows a poor negative correlation between the proportion of Palestinians and percentage of males with a disability in the United States with a correlation coefficient (R) of -0.145 and weighted average of 10.7%, a difference of 24.9%.
Male Disability Correlation Summary
| Measurement | Spanish American | Palestinian |
| Minimum | 1.4% | 3.0% |
| Maximum | 100.0% | 19.3% |
| Range | 98.6% | 16.3% |
| Mean | 19.4% | 10.8% |
| Median | 15.6% | 10.5% |
| Interquartile 25% (IQ1) | 13.1% | 9.1% |
| Interquartile 75% (IQ3) | 22.2% | 12.0% |
| Interquartile Range (IQR) | 9.0% | 2.9% |
| Standard Deviation (Sample) | 14.1% | 3.4% |
| Standard Deviation (Population) | 14.0% | 3.4% |
Similar Demographics by Male Disability
Demographics Similar to Spanish Americans by Male Disability
In terms of male disability, the demographic groups most similar to Spanish Americans are French Canadian (13.3%, a difference of 0.20%), Arapaho (13.3%, a difference of 0.22%), French American Indian (13.4%, a difference of 0.38%), Black/African American (13.2%, a difference of 0.61%), and Blackfeet (13.4%, a difference of 0.80%).
| Demographics | Rating | Rank | Male Disability |
| Celtics | 0.0 /100 | #299 | Tragic 13.0% |
| Cheyenne | 0.0 /100 | #300 | Tragic 13.0% |
| French | 0.0 /100 | #301 | Tragic 13.0% |
| Crow | 0.0 /100 | #302 | Tragic 13.1% |
| Scotch-Irish | 0.0 /100 | #303 | Tragic 13.2% |
| Blacks/African Americans | 0.0 /100 | #304 | Tragic 13.2% |
| French Canadians | 0.0 /100 | #305 | Tragic 13.3% |
| Spanish Americans | 0.0 /100 | #306 | Tragic 13.3% |
| Arapaho | 0.0 /100 | #307 | Tragic 13.3% |
| French American Indians | 0.0 /100 | #308 | Tragic 13.4% |
| Blackfeet | 0.0 /100 | #309 | Tragic 13.4% |
| Immigrants | Azores | 0.0 /100 | #310 | Tragic 13.4% |
| Delaware | 0.0 /100 | #311 | Tragic 13.5% |
| Yakama | 0.0 /100 | #312 | Tragic 13.5% |
| Puget Sound Salish | 0.0 /100 | #313 | Tragic 13.5% |
Demographics Similar to Palestinians by Male Disability
In terms of male disability, the demographic groups most similar to Palestinians are Immigrants from St. Vincent and the Grenadines (10.7%, a difference of 0.13%), Immigrants from France (10.6%, a difference of 0.15%), Immigrants from Morocco (10.6%, a difference of 0.18%), Immigrants from Western Asia (10.6%, a difference of 0.24%), and Immigrants from Nicaragua (10.6%, a difference of 0.24%).
| Demographics | Rating | Rank | Male Disability |
| Sri Lankans | 97.9 /100 | #85 | Exceptional 10.6% |
| Immigrants | Ireland | 97.9 /100 | #86 | Exceptional 10.6% |
| Immigrants | Vietnam | 97.9 /100 | #87 | Exceptional 10.6% |
| Immigrants | Western Asia | 97.8 /100 | #88 | Exceptional 10.6% |
| Immigrants | Nicaragua | 97.8 /100 | #89 | Exceptional 10.6% |
| Immigrants | Morocco | 97.7 /100 | #90 | Exceptional 10.6% |
| Immigrants | France | 97.6 /100 | #91 | Exceptional 10.6% |
| Palestinians | 97.4 /100 | #92 | Exceptional 10.7% |
| Immigrants | St. Vincent and the Grenadines | 97.1 /100 | #93 | Exceptional 10.7% |
| Immigrants | Sweden | 96.9 /100 | #94 | Exceptional 10.7% |
| Chileans | 96.9 /100 | #95 | Exceptional 10.7% |
| Nicaraguans | 96.6 /100 | #96 | Exceptional 10.7% |
| Immigrants | Armenia | 96.6 /100 | #97 | Exceptional 10.7% |
| Immigrants | Romania | 96.5 /100 | #98 | Exceptional 10.7% |
| Immigrants | Switzerland | 96.1 /100 | #99 | Exceptional 10.7% |