Luxembourger vs Mongolian Female Disability
COMPARE
Luxembourger
Mongolian
Female Disability
Female Disability Comparison
Luxembourgers
Mongolians
11.6%
FEMALE DISABILITY
99.6/ 100
METRIC RATING
82nd/ 347
METRIC RANK
11.2%
FEMALE DISABILITY
100.0/ 100
METRIC RATING
40th/ 347
METRIC RANK
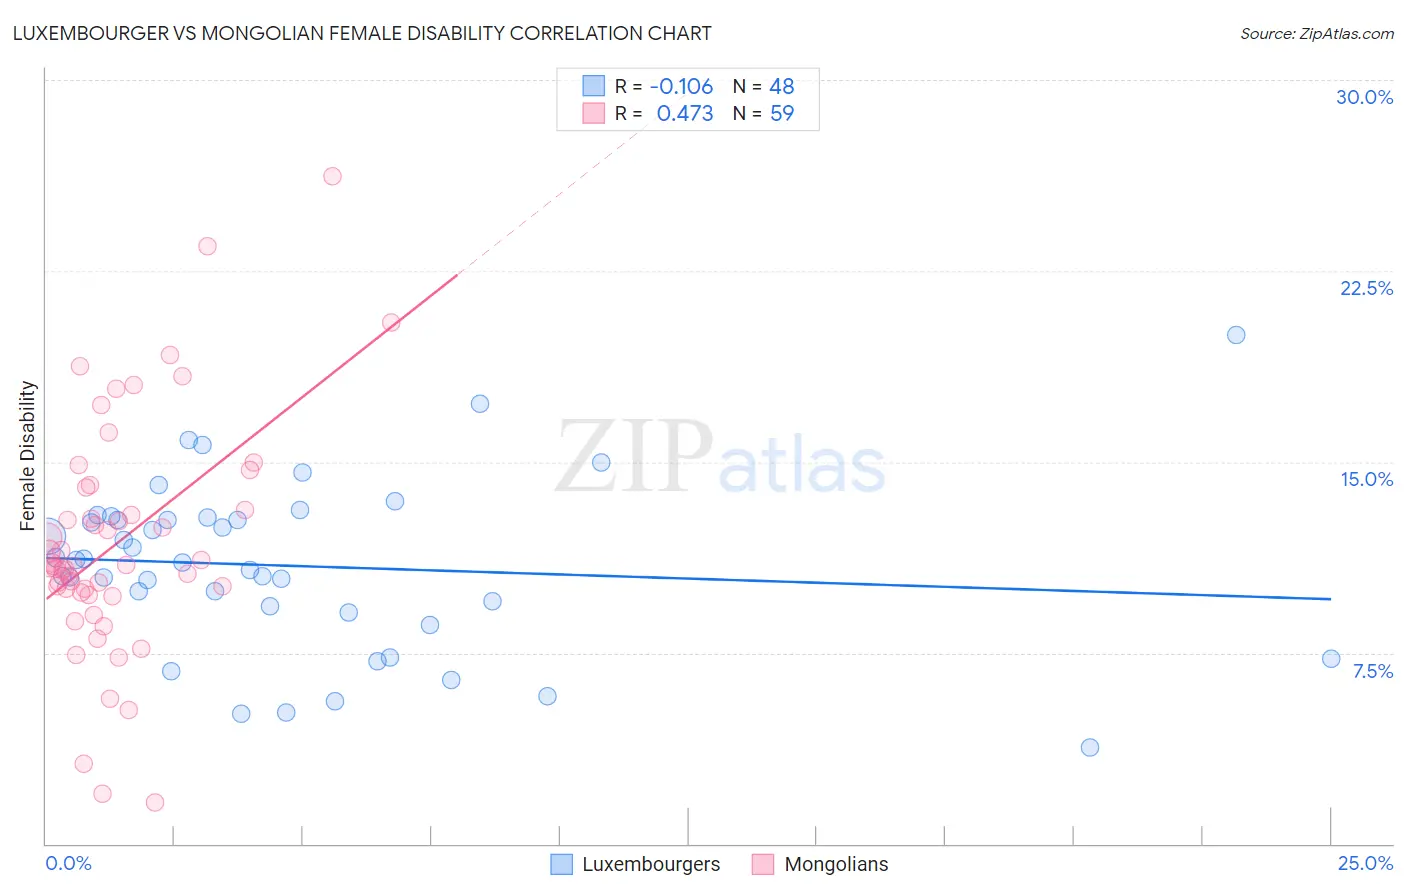
Luxembourger vs Mongolian Female Disability Correlation Chart
The statistical analysis conducted on geographies consisting of 144,677,023 people shows a poor negative correlation between the proportion of Luxembourgers and percentage of females with a disability in the United States with a correlation coefficient (R) of -0.106 and weighted average of 11.6%. Similarly, the statistical analysis conducted on geographies consisting of 140,358,639 people shows a moderate positive correlation between the proportion of Mongolians and percentage of females with a disability in the United States with a correlation coefficient (R) of 0.473 and weighted average of 11.2%, a difference of 3.0%.
Female Disability Correlation Summary
| Measurement | Luxembourger | Mongolian |
| Minimum | 3.8% | 1.6% |
| Maximum | 20.0% | 26.2% |
| Range | 16.2% | 24.6% |
| Mean | 10.9% | 11.8% |
| Median | 11.1% | 10.9% |
| Interquartile 25% (IQ1) | 9.2% | 9.9% |
| Interquartile 75% (IQ3) | 12.8% | 14.0% |
| Interquartile Range (IQR) | 3.6% | 4.1% |
| Standard Deviation (Sample) | 3.3% | 4.6% |
| Standard Deviation (Population) | 3.3% | 4.6% |
Similar Demographics by Female Disability
Demographics Similar to Luxembourgers by Female Disability
In terms of female disability, the demographic groups most similar to Luxembourgers are Immigrants from Serbia (11.6%, a difference of 0.020%), Immigrants from Poland (11.6%, a difference of 0.050%), Palestinian (11.6%, a difference of 0.080%), Immigrants from Cameroon (11.6%, a difference of 0.080%), and Immigrants from Denmark (11.6%, a difference of 0.15%).
| Demographics | Rating | Rank | Female Disability |
| Immigrants | Lebanon | 99.7 /100 | #75 | Exceptional 11.5% |
| Immigrants | Eritrea | 99.7 /100 | #76 | Exceptional 11.5% |
| Immigrants | Afghanistan | 99.7 /100 | #77 | Exceptional 11.5% |
| Immigrants | South Africa | 99.7 /100 | #78 | Exceptional 11.5% |
| Sierra Leoneans | 99.7 /100 | #79 | Exceptional 11.5% |
| Immigrants | Jordan | 99.7 /100 | #80 | Exceptional 11.5% |
| Eastern Europeans | 99.7 /100 | #81 | Exceptional 11.5% |
| Luxembourgers | 99.6 /100 | #82 | Exceptional 11.6% |
| Immigrants | Serbia | 99.6 /100 | #83 | Exceptional 11.6% |
| Immigrants | Poland | 99.6 /100 | #84 | Exceptional 11.6% |
| Palestinians | 99.6 /100 | #85 | Exceptional 11.6% |
| Immigrants | Cameroon | 99.6 /100 | #86 | Exceptional 11.6% |
| Immigrants | Denmark | 99.5 /100 | #87 | Exceptional 11.6% |
| Yup'ik | 99.5 /100 | #88 | Exceptional 11.6% |
| Vietnamese | 99.5 /100 | #89 | Exceptional 11.6% |
Demographics Similar to Mongolians by Female Disability
In terms of female disability, the demographic groups most similar to Mongolians are Paraguayan (11.2%, a difference of 0.020%), Immigrants from Lithuania (11.2%, a difference of 0.030%), Israeli (11.2%, a difference of 0.11%), Afghan (11.2%, a difference of 0.14%), and Immigrants from Ethiopia (11.2%, a difference of 0.24%).
| Demographics | Rating | Rank | Female Disability |
| Immigrants | Egypt | 100.0 /100 | #33 | Exceptional 11.1% |
| Immigrants | Indonesia | 100.0 /100 | #34 | Exceptional 11.2% |
| Immigrants | Japan | 100.0 /100 | #35 | Exceptional 11.2% |
| Cypriots | 100.0 /100 | #36 | Exceptional 11.2% |
| Ethiopians | 100.0 /100 | #37 | Exceptional 11.2% |
| Immigrants | Ethiopia | 100.0 /100 | #38 | Exceptional 11.2% |
| Immigrants | Lithuania | 100.0 /100 | #39 | Exceptional 11.2% |
| Mongolians | 100.0 /100 | #40 | Exceptional 11.2% |
| Paraguayans | 100.0 /100 | #41 | Exceptional 11.2% |
| Israelis | 100.0 /100 | #42 | Exceptional 11.2% |
| Afghans | 100.0 /100 | #43 | Exceptional 11.2% |
| Cambodians | 100.0 /100 | #44 | Exceptional 11.3% |
| Immigrants | Sweden | 100.0 /100 | #45 | Exceptional 11.3% |
| Immigrants | Nepal | 100.0 /100 | #46 | Exceptional 11.3% |
| Jordanians | 100.0 /100 | #47 | Exceptional 11.3% |