Latvian vs Mongolian Female Disability
COMPARE
Latvian
Mongolian
Female Disability
Female Disability Comparison
Latvians
Mongolians
11.7%
FEMALE DISABILITY
98.2/ 100
METRIC RATING
107th/ 347
METRIC RANK
11.2%
FEMALE DISABILITY
100.0/ 100
METRIC RATING
40th/ 347
METRIC RANK
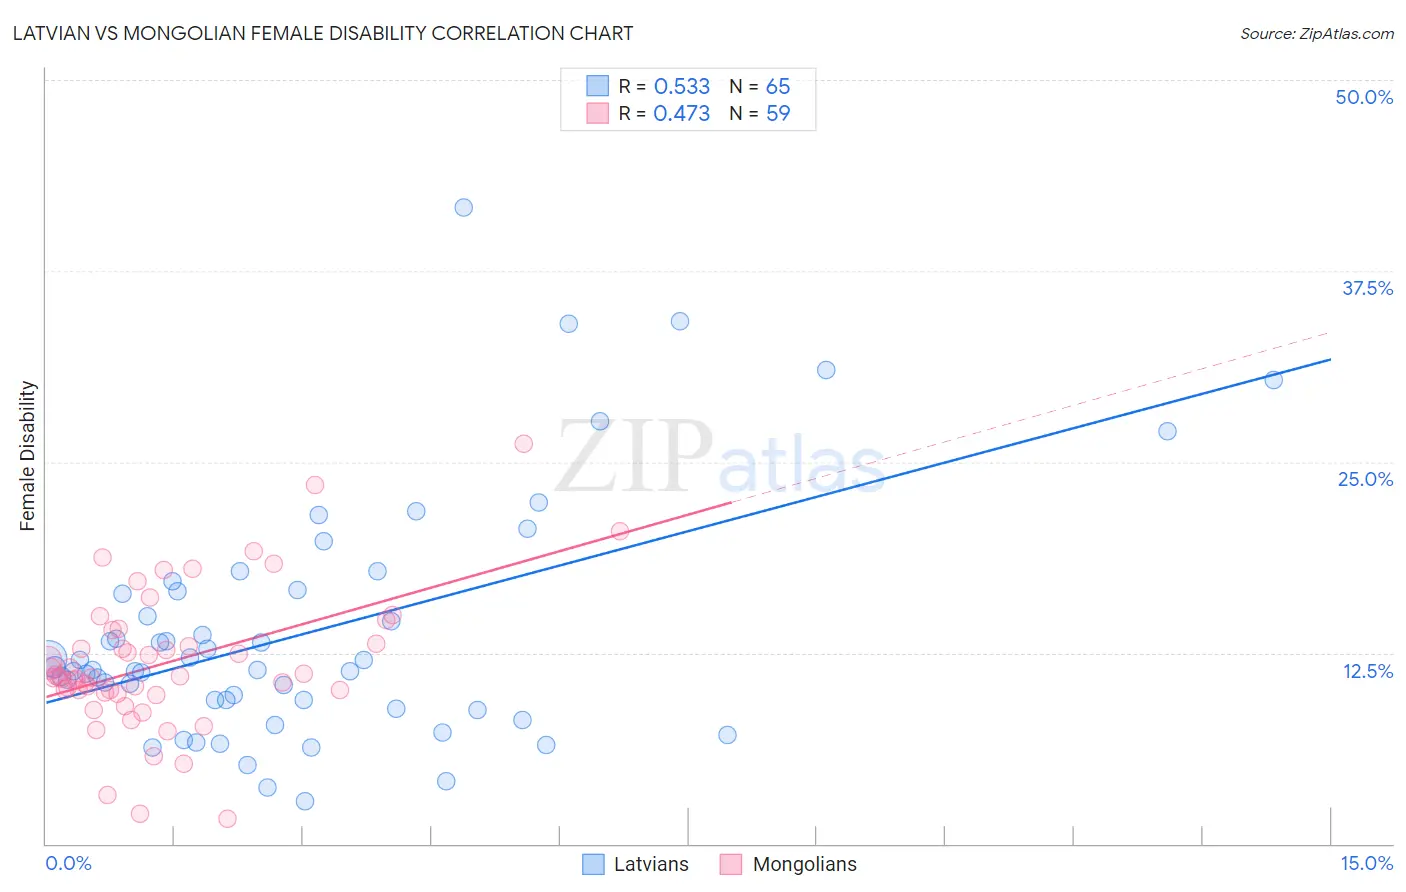
Latvian vs Mongolian Female Disability Correlation Chart
The statistical analysis conducted on geographies consisting of 220,713,826 people shows a substantial positive correlation between the proportion of Latvians and percentage of females with a disability in the United States with a correlation coefficient (R) of 0.533 and weighted average of 11.7%. Similarly, the statistical analysis conducted on geographies consisting of 140,358,639 people shows a moderate positive correlation between the proportion of Mongolians and percentage of females with a disability in the United States with a correlation coefficient (R) of 0.473 and weighted average of 11.2%, a difference of 4.6%.
Female Disability Correlation Summary
| Measurement | Latvian | Mongolian |
| Minimum | 2.8% | 1.6% |
| Maximum | 41.7% | 26.2% |
| Range | 38.8% | 24.6% |
| Mean | 13.9% | 11.8% |
| Median | 11.4% | 10.9% |
| Interquartile 25% (IQ1) | 9.1% | 9.9% |
| Interquartile 75% (IQ3) | 16.6% | 14.0% |
| Interquartile Range (IQR) | 7.5% | 4.1% |
| Standard Deviation (Sample) | 7.9% | 4.6% |
| Standard Deviation (Population) | 7.8% | 4.6% |
Similar Demographics by Female Disability
Demographics Similar to Latvians by Female Disability
In terms of female disability, the demographic groups most similar to Latvians are Immigrants from Greece (11.7%, a difference of 0.020%), New Zealander (11.7%, a difference of 0.020%), Australian (11.7%, a difference of 0.050%), Immigrants (11.7%, a difference of 0.050%), and Soviet Union (11.7%, a difference of 0.050%).
| Demographics | Rating | Rank | Female Disability |
| Immigrants | Uruguay | 98.5 /100 | #100 | Exceptional 11.7% |
| Immigrants | Costa Rica | 98.4 /100 | #101 | Exceptional 11.7% |
| Immigrants | South Eastern Asia | 98.4 /100 | #102 | Exceptional 11.7% |
| Immigrants | Eastern Africa | 98.3 /100 | #103 | Exceptional 11.7% |
| Immigrants | Western Asia | 98.3 /100 | #104 | Exceptional 11.7% |
| Australians | 98.3 /100 | #105 | Exceptional 11.7% |
| Immigrants | Greece | 98.2 /100 | #106 | Exceptional 11.7% |
| Latvians | 98.2 /100 | #107 | Exceptional 11.7% |
| New Zealanders | 98.1 /100 | #108 | Exceptional 11.7% |
| Immigrants | Immigrants | 98.1 /100 | #109 | Exceptional 11.7% |
| Soviet Union | 98.1 /100 | #110 | Exceptional 11.7% |
| Costa Ricans | 98.1 /100 | #111 | Exceptional 11.7% |
| Immigrants | Bangladesh | 97.8 /100 | #112 | Exceptional 11.8% |
| Immigrants | Belarus | 97.8 /100 | #113 | Exceptional 11.8% |
| South Africans | 97.7 /100 | #114 | Exceptional 11.8% |
Demographics Similar to Mongolians by Female Disability
In terms of female disability, the demographic groups most similar to Mongolians are Paraguayan (11.2%, a difference of 0.020%), Immigrants from Lithuania (11.2%, a difference of 0.030%), Israeli (11.2%, a difference of 0.11%), Afghan (11.2%, a difference of 0.14%), and Immigrants from Ethiopia (11.2%, a difference of 0.24%).
| Demographics | Rating | Rank | Female Disability |
| Immigrants | Egypt | 100.0 /100 | #33 | Exceptional 11.1% |
| Immigrants | Indonesia | 100.0 /100 | #34 | Exceptional 11.2% |
| Immigrants | Japan | 100.0 /100 | #35 | Exceptional 11.2% |
| Cypriots | 100.0 /100 | #36 | Exceptional 11.2% |
| Ethiopians | 100.0 /100 | #37 | Exceptional 11.2% |
| Immigrants | Ethiopia | 100.0 /100 | #38 | Exceptional 11.2% |
| Immigrants | Lithuania | 100.0 /100 | #39 | Exceptional 11.2% |
| Mongolians | 100.0 /100 | #40 | Exceptional 11.2% |
| Paraguayans | 100.0 /100 | #41 | Exceptional 11.2% |
| Israelis | 100.0 /100 | #42 | Exceptional 11.2% |
| Afghans | 100.0 /100 | #43 | Exceptional 11.2% |
| Cambodians | 100.0 /100 | #44 | Exceptional 11.3% |
| Immigrants | Sweden | 100.0 /100 | #45 | Exceptional 11.3% |
| Immigrants | Nepal | 100.0 /100 | #46 | Exceptional 11.3% |
| Jordanians | 100.0 /100 | #47 | Exceptional 11.3% |