Immigrants from Pakistan vs Mongolian Female Disability
COMPARE
Immigrants from Pakistan
Mongolian
Female Disability
Female Disability Comparison
Immigrants from Pakistan
Mongolians
10.9%
FEMALE DISABILITY
100.0/ 100
METRIC RATING
20th/ 347
METRIC RANK
11.2%
FEMALE DISABILITY
100.0/ 100
METRIC RATING
40th/ 347
METRIC RANK
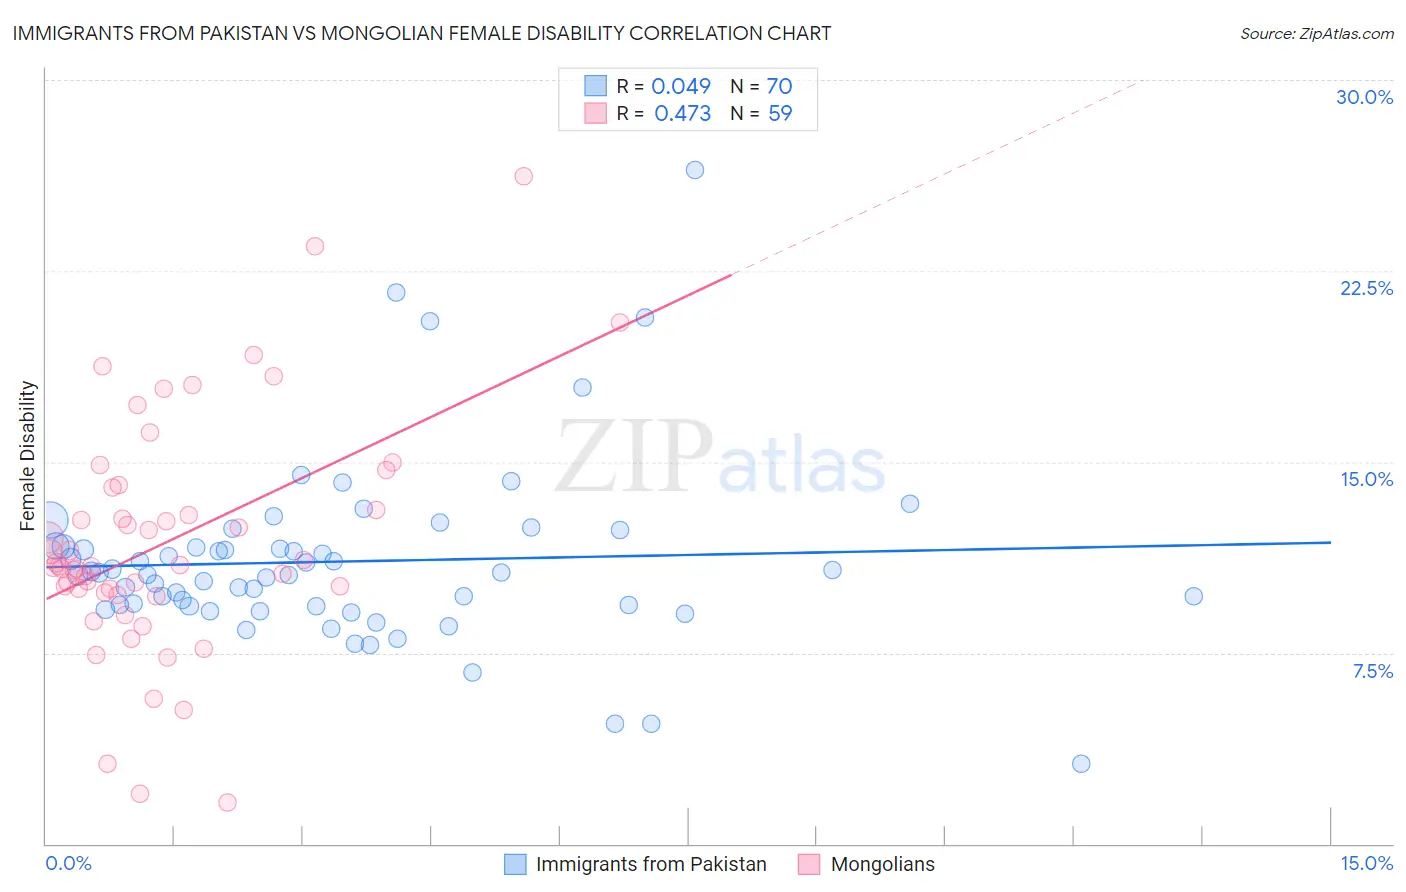
Immigrants from Pakistan vs Mongolian Female Disability Correlation Chart
The statistical analysis conducted on geographies consisting of 283,889,302 people shows no correlation between the proportion of Immigrants from Pakistan and percentage of females with a disability in the United States with a correlation coefficient (R) of 0.049 and weighted average of 10.9%. Similarly, the statistical analysis conducted on geographies consisting of 140,358,639 people shows a moderate positive correlation between the proportion of Mongolians and percentage of females with a disability in the United States with a correlation coefficient (R) of 0.473 and weighted average of 11.2%, a difference of 3.2%.
Female Disability Correlation Summary
| Measurement | Immigrants from Pakistan | Mongolian |
| Minimum | 3.1% | 1.6% |
| Maximum | 26.5% | 26.2% |
| Range | 23.3% | 24.6% |
| Mean | 11.1% | 11.8% |
| Median | 10.6% | 10.9% |
| Interquartile 25% (IQ1) | 9.3% | 9.9% |
| Interquartile 75% (IQ3) | 11.7% | 14.0% |
| Interquartile Range (IQR) | 2.3% | 4.1% |
| Standard Deviation (Sample) | 3.6% | 4.6% |
| Standard Deviation (Population) | 3.6% | 4.6% |
Demographics Similar to Immigrants from Pakistan and Mongolians by Female Disability
In terms of female disability, the demographic groups most similar to Immigrants from Pakistan are Asian (10.9%, a difference of 0.36%), Immigrants from Sri Lanka (10.9%, a difference of 0.49%), Venezuelan (11.0%, a difference of 0.71%), Immigrants from Argentina (11.0%, a difference of 1.3%), and Immigrants from Asia (11.0%, a difference of 1.3%). Similarly, the demographic groups most similar to Mongolians are Immigrants from Lithuania (11.2%, a difference of 0.030%), Immigrants from Ethiopia (11.2%, a difference of 0.24%), Ethiopian (11.2%, a difference of 0.27%), Cypriot (11.2%, a difference of 0.28%), and Immigrants from Japan (11.2%, a difference of 0.35%).
| Demographics | Rating | Rank | Female Disability |
| Immigrants | Pakistan | 100.0 /100 | #20 | Exceptional 10.9% |
| Asians | 100.0 /100 | #21 | Exceptional 10.9% |
| Immigrants | Sri Lanka | 100.0 /100 | #22 | Exceptional 10.9% |
| Venezuelans | 100.0 /100 | #23 | Exceptional 11.0% |
| Immigrants | Argentina | 100.0 /100 | #24 | Exceptional 11.0% |
| Immigrants | Asia | 100.0 /100 | #25 | Exceptional 11.0% |
| Argentineans | 100.0 /100 | #26 | Exceptional 11.0% |
| Immigrants | Turkey | 100.0 /100 | #27 | Exceptional 11.1% |
| Egyptians | 100.0 /100 | #28 | Exceptional 11.1% |
| Immigrants | Malaysia | 100.0 /100 | #29 | Exceptional 11.1% |
| Turks | 100.0 /100 | #30 | Exceptional 11.1% |
| Immigrants | Kuwait | 100.0 /100 | #31 | Exceptional 11.1% |
| Immigrants | Australia | 100.0 /100 | #32 | Exceptional 11.1% |
| Immigrants | Egypt | 100.0 /100 | #33 | Exceptional 11.1% |
| Immigrants | Indonesia | 100.0 /100 | #34 | Exceptional 11.2% |
| Immigrants | Japan | 100.0 /100 | #35 | Exceptional 11.2% |
| Cypriots | 100.0 /100 | #36 | Exceptional 11.2% |
| Ethiopians | 100.0 /100 | #37 | Exceptional 11.2% |
| Immigrants | Ethiopia | 100.0 /100 | #38 | Exceptional 11.2% |
| Immigrants | Lithuania | 100.0 /100 | #39 | Exceptional 11.2% |
| Mongolians | 100.0 /100 | #40 | Exceptional 11.2% |