Hawaiian vs Mongolian Female Disability
COMPARE
Hawaiian
Mongolian
Female Disability
Female Disability Comparison
Hawaiians
Mongolians
12.7%
FEMALE DISABILITY
1.4/ 100
METRIC RATING
254th/ 347
METRIC RANK
11.2%
FEMALE DISABILITY
100.0/ 100
METRIC RATING
40th/ 347
METRIC RANK
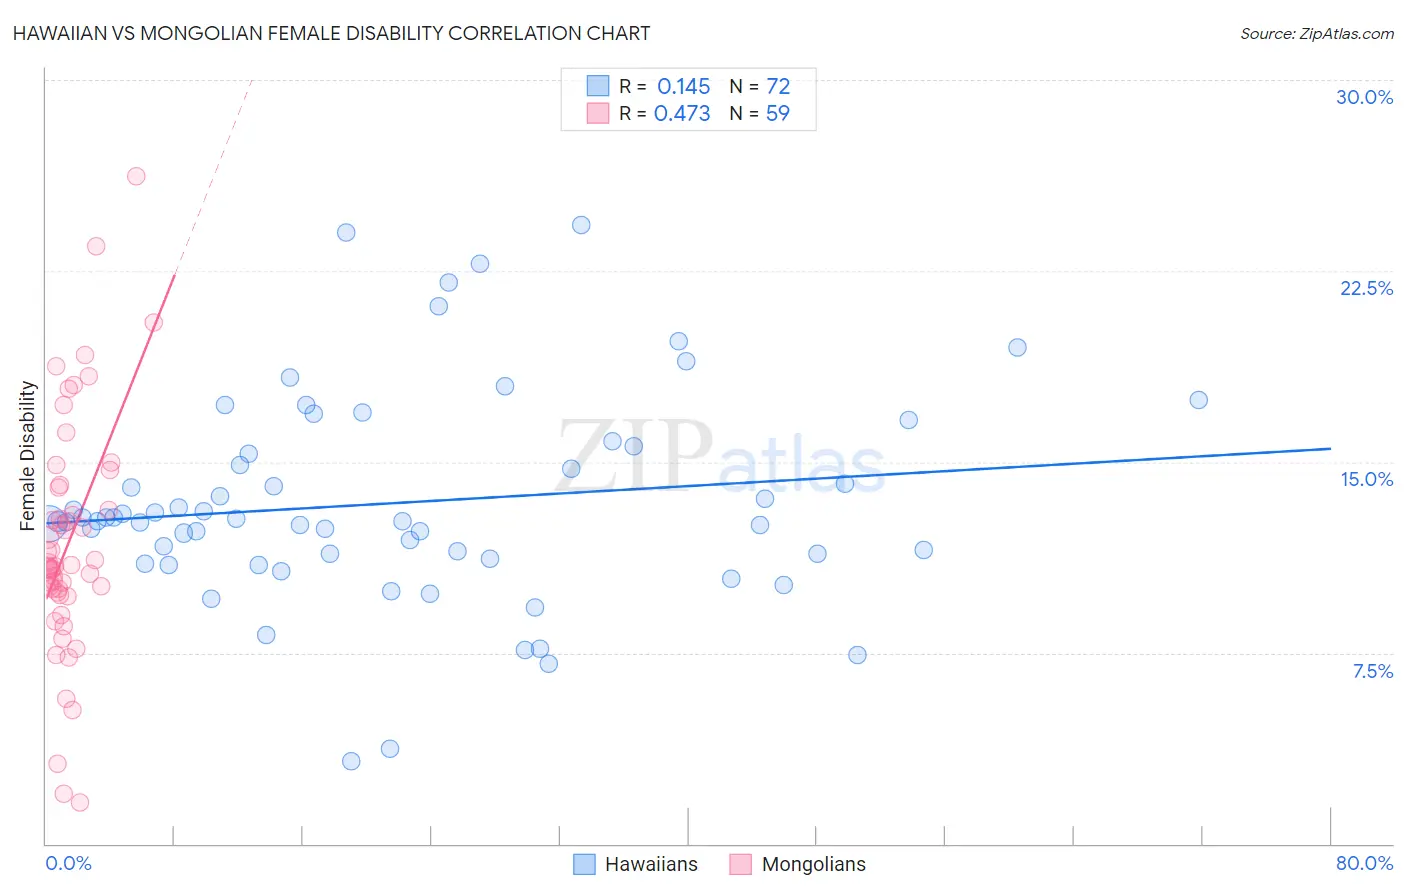
Hawaiian vs Mongolian Female Disability Correlation Chart
The statistical analysis conducted on geographies consisting of 327,480,697 people shows a poor positive correlation between the proportion of Hawaiians and percentage of females with a disability in the United States with a correlation coefficient (R) of 0.145 and weighted average of 12.7%. Similarly, the statistical analysis conducted on geographies consisting of 140,358,639 people shows a moderate positive correlation between the proportion of Mongolians and percentage of females with a disability in the United States with a correlation coefficient (R) of 0.473 and weighted average of 11.2%, a difference of 13.0%.
Female Disability Correlation Summary
| Measurement | Hawaiian | Mongolian |
| Minimum | 3.3% | 1.6% |
| Maximum | 24.3% | 26.2% |
| Range | 21.1% | 24.6% |
| Mean | 13.4% | 11.8% |
| Median | 12.7% | 10.9% |
| Interquartile 25% (IQ1) | 11.3% | 9.9% |
| Interquartile 75% (IQ3) | 15.5% | 14.0% |
| Interquartile Range (IQR) | 4.2% | 4.1% |
| Standard Deviation (Sample) | 4.1% | 4.6% |
| Standard Deviation (Population) | 4.1% | 4.6% |
Similar Demographics by Female Disability
Demographics Similar to Hawaiians by Female Disability
In terms of female disability, the demographic groups most similar to Hawaiians are Jamaican (12.7%, a difference of 0.030%), Immigrants from Caribbean (12.7%, a difference of 0.040%), Immigrants from Germany (12.7%, a difference of 0.080%), Crow (12.7%, a difference of 0.12%), and British West Indian (12.7%, a difference of 0.15%).
| Demographics | Rating | Rank | Female Disability |
| Menominee | 2.1 /100 | #247 | Tragic 12.6% |
| Carpatho Rusyns | 2.0 /100 | #248 | Tragic 12.6% |
| Immigrants | Congo | 1.8 /100 | #249 | Tragic 12.7% |
| Slovenes | 1.7 /100 | #250 | Tragic 12.7% |
| Crow | 1.6 /100 | #251 | Tragic 12.7% |
| Immigrants | Caribbean | 1.4 /100 | #252 | Tragic 12.7% |
| Jamaicans | 1.4 /100 | #253 | Tragic 12.7% |
| Hawaiians | 1.4 /100 | #254 | Tragic 12.7% |
| Immigrants | Germany | 1.3 /100 | #255 | Tragic 12.7% |
| British West Indians | 1.2 /100 | #256 | Tragic 12.7% |
| Liberians | 1.1 /100 | #257 | Tragic 12.7% |
| Aleuts | 1.1 /100 | #258 | Tragic 12.7% |
| Immigrants | Armenia | 1.0 /100 | #259 | Tragic 12.7% |
| Sub-Saharan Africans | 1.0 /100 | #260 | Tragic 12.7% |
| Bermudans | 1.0 /100 | #261 | Tragic 12.7% |
Demographics Similar to Mongolians by Female Disability
In terms of female disability, the demographic groups most similar to Mongolians are Paraguayan (11.2%, a difference of 0.020%), Immigrants from Lithuania (11.2%, a difference of 0.030%), Israeli (11.2%, a difference of 0.11%), Afghan (11.2%, a difference of 0.14%), and Immigrants from Ethiopia (11.2%, a difference of 0.24%).
| Demographics | Rating | Rank | Female Disability |
| Immigrants | Egypt | 100.0 /100 | #33 | Exceptional 11.1% |
| Immigrants | Indonesia | 100.0 /100 | #34 | Exceptional 11.2% |
| Immigrants | Japan | 100.0 /100 | #35 | Exceptional 11.2% |
| Cypriots | 100.0 /100 | #36 | Exceptional 11.2% |
| Ethiopians | 100.0 /100 | #37 | Exceptional 11.2% |
| Immigrants | Ethiopia | 100.0 /100 | #38 | Exceptional 11.2% |
| Immigrants | Lithuania | 100.0 /100 | #39 | Exceptional 11.2% |
| Mongolians | 100.0 /100 | #40 | Exceptional 11.2% |
| Paraguayans | 100.0 /100 | #41 | Exceptional 11.2% |
| Israelis | 100.0 /100 | #42 | Exceptional 11.2% |
| Afghans | 100.0 /100 | #43 | Exceptional 11.2% |
| Cambodians | 100.0 /100 | #44 | Exceptional 11.3% |
| Immigrants | Sweden | 100.0 /100 | #45 | Exceptional 11.3% |
| Immigrants | Nepal | 100.0 /100 | #46 | Exceptional 11.3% |
| Jordanians | 100.0 /100 | #47 | Exceptional 11.3% |