West Indian vs Mongolian Female Disability
COMPARE
West Indian
Mongolian
Female Disability
Female Disability Comparison
West Indians
Mongolians
12.8%
FEMALE DISABILITY
0.5/ 100
METRIC RATING
265th/ 347
METRIC RANK
11.2%
FEMALE DISABILITY
100.0/ 100
METRIC RATING
40th/ 347
METRIC RANK
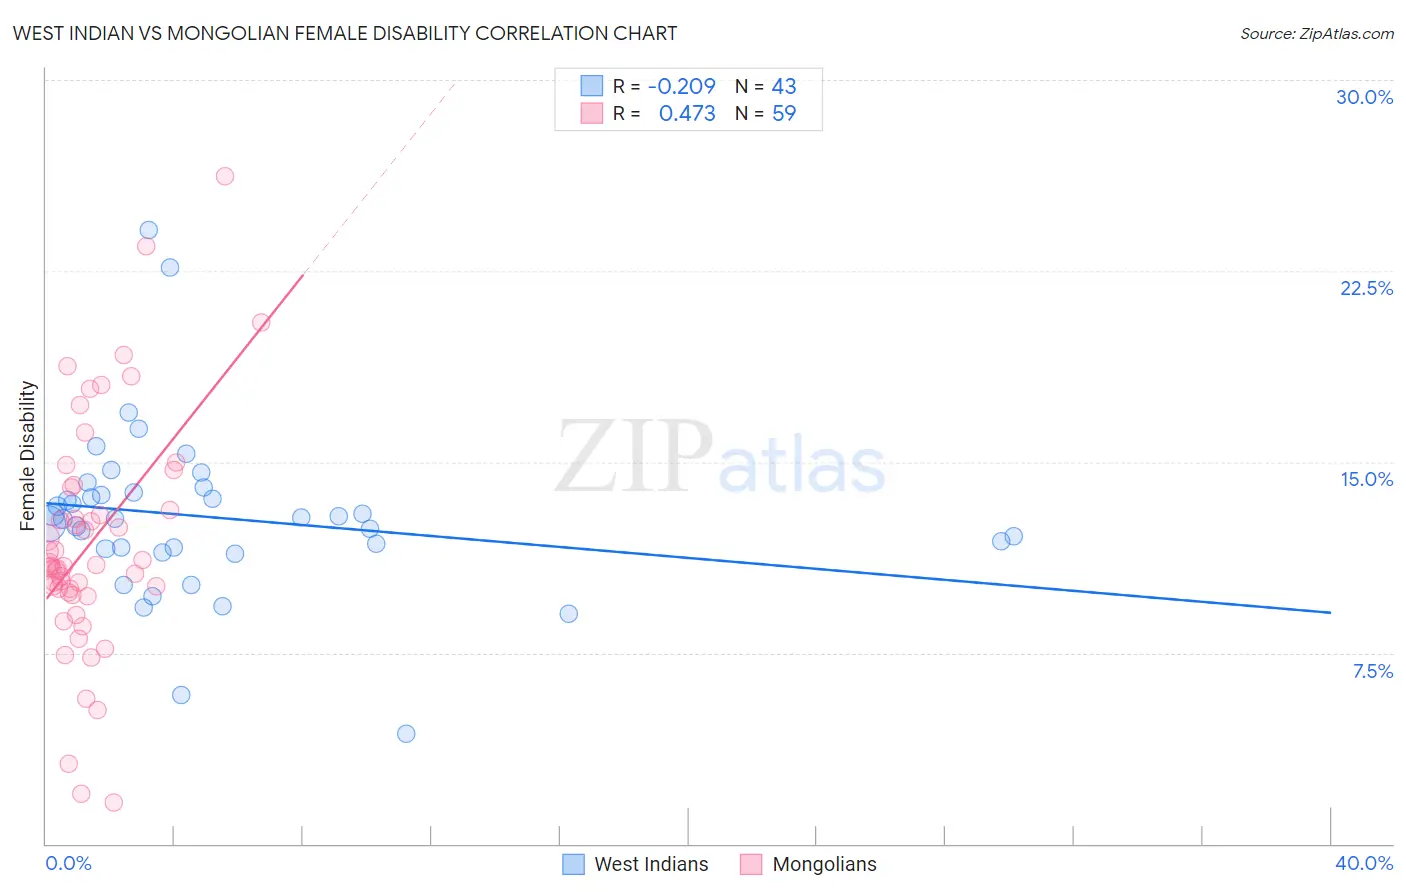
West Indian vs Mongolian Female Disability Correlation Chart
The statistical analysis conducted on geographies consisting of 254,014,904 people shows a weak negative correlation between the proportion of West Indians and percentage of females with a disability in the United States with a correlation coefficient (R) of -0.209 and weighted average of 12.8%. Similarly, the statistical analysis conducted on geographies consisting of 140,358,639 people shows a moderate positive correlation between the proportion of Mongolians and percentage of females with a disability in the United States with a correlation coefficient (R) of 0.473 and weighted average of 11.2%, a difference of 14.1%.
Female Disability Correlation Summary
| Measurement | West Indian | Mongolian |
| Minimum | 4.3% | 1.6% |
| Maximum | 24.1% | 26.2% |
| Range | 19.8% | 24.6% |
| Mean | 12.8% | 11.8% |
| Median | 12.8% | 10.9% |
| Interquartile 25% (IQ1) | 11.6% | 9.9% |
| Interquartile 75% (IQ3) | 13.8% | 14.0% |
| Interquartile Range (IQR) | 2.2% | 4.1% |
| Standard Deviation (Sample) | 3.4% | 4.6% |
| Standard Deviation (Population) | 3.3% | 4.6% |
Similar Demographics by Female Disability
Demographics Similar to West Indians by Female Disability
In terms of female disability, the demographic groups most similar to West Indians are Finnish (12.8%, a difference of 0.12%), Senegalese (12.8%, a difference of 0.13%), Immigrants from Laos (12.8%, a difference of 0.16%), Alaska Native (12.8%, a difference of 0.19%), and Indonesian (12.8%, a difference of 0.22%).
| Demographics | Rating | Rank | Female Disability |
| Aleuts | 1.1 /100 | #258 | Tragic 12.7% |
| Immigrants | Armenia | 1.0 /100 | #259 | Tragic 12.7% |
| Sub-Saharan Africans | 1.0 /100 | #260 | Tragic 12.7% |
| Bermudans | 1.0 /100 | #261 | Tragic 12.7% |
| Czechoslovakians | 0.9 /100 | #262 | Tragic 12.7% |
| Spaniards | 0.7 /100 | #263 | Tragic 12.8% |
| Alaska Natives | 0.6 /100 | #264 | Tragic 12.8% |
| West Indians | 0.5 /100 | #265 | Tragic 12.8% |
| Finns | 0.4 /100 | #266 | Tragic 12.8% |
| Senegalese | 0.4 /100 | #267 | Tragic 12.8% |
| Immigrants | Laos | 0.4 /100 | #268 | Tragic 12.8% |
| Indonesians | 0.4 /100 | #269 | Tragic 12.8% |
| Immigrants | Liberia | 0.3 /100 | #270 | Tragic 12.9% |
| Dutch | 0.2 /100 | #271 | Tragic 12.9% |
| Germans | 0.1 /100 | #272 | Tragic 12.9% |
Demographics Similar to Mongolians by Female Disability
In terms of female disability, the demographic groups most similar to Mongolians are Paraguayan (11.2%, a difference of 0.020%), Immigrants from Lithuania (11.2%, a difference of 0.030%), Israeli (11.2%, a difference of 0.11%), Afghan (11.2%, a difference of 0.14%), and Immigrants from Ethiopia (11.2%, a difference of 0.24%).
| Demographics | Rating | Rank | Female Disability |
| Immigrants | Egypt | 100.0 /100 | #33 | Exceptional 11.1% |
| Immigrants | Indonesia | 100.0 /100 | #34 | Exceptional 11.2% |
| Immigrants | Japan | 100.0 /100 | #35 | Exceptional 11.2% |
| Cypriots | 100.0 /100 | #36 | Exceptional 11.2% |
| Ethiopians | 100.0 /100 | #37 | Exceptional 11.2% |
| Immigrants | Ethiopia | 100.0 /100 | #38 | Exceptional 11.2% |
| Immigrants | Lithuania | 100.0 /100 | #39 | Exceptional 11.2% |
| Mongolians | 100.0 /100 | #40 | Exceptional 11.2% |
| Paraguayans | 100.0 /100 | #41 | Exceptional 11.2% |
| Israelis | 100.0 /100 | #42 | Exceptional 11.2% |
| Afghans | 100.0 /100 | #43 | Exceptional 11.2% |
| Cambodians | 100.0 /100 | #44 | Exceptional 11.3% |
| Immigrants | Sweden | 100.0 /100 | #45 | Exceptional 11.3% |
| Immigrants | Nepal | 100.0 /100 | #46 | Exceptional 11.3% |
| Jordanians | 100.0 /100 | #47 | Exceptional 11.3% |