Luxembourger vs Osage Female Disability
COMPARE
Luxembourger
Osage
Female Disability
Female Disability Comparison
Luxembourgers
Osage
11.6%
FEMALE DISABILITY
99.6/ 100
METRIC RATING
82nd/ 347
METRIC RANK
14.3%
FEMALE DISABILITY
0.0/ 100
METRIC RATING
329th/ 347
METRIC RANK
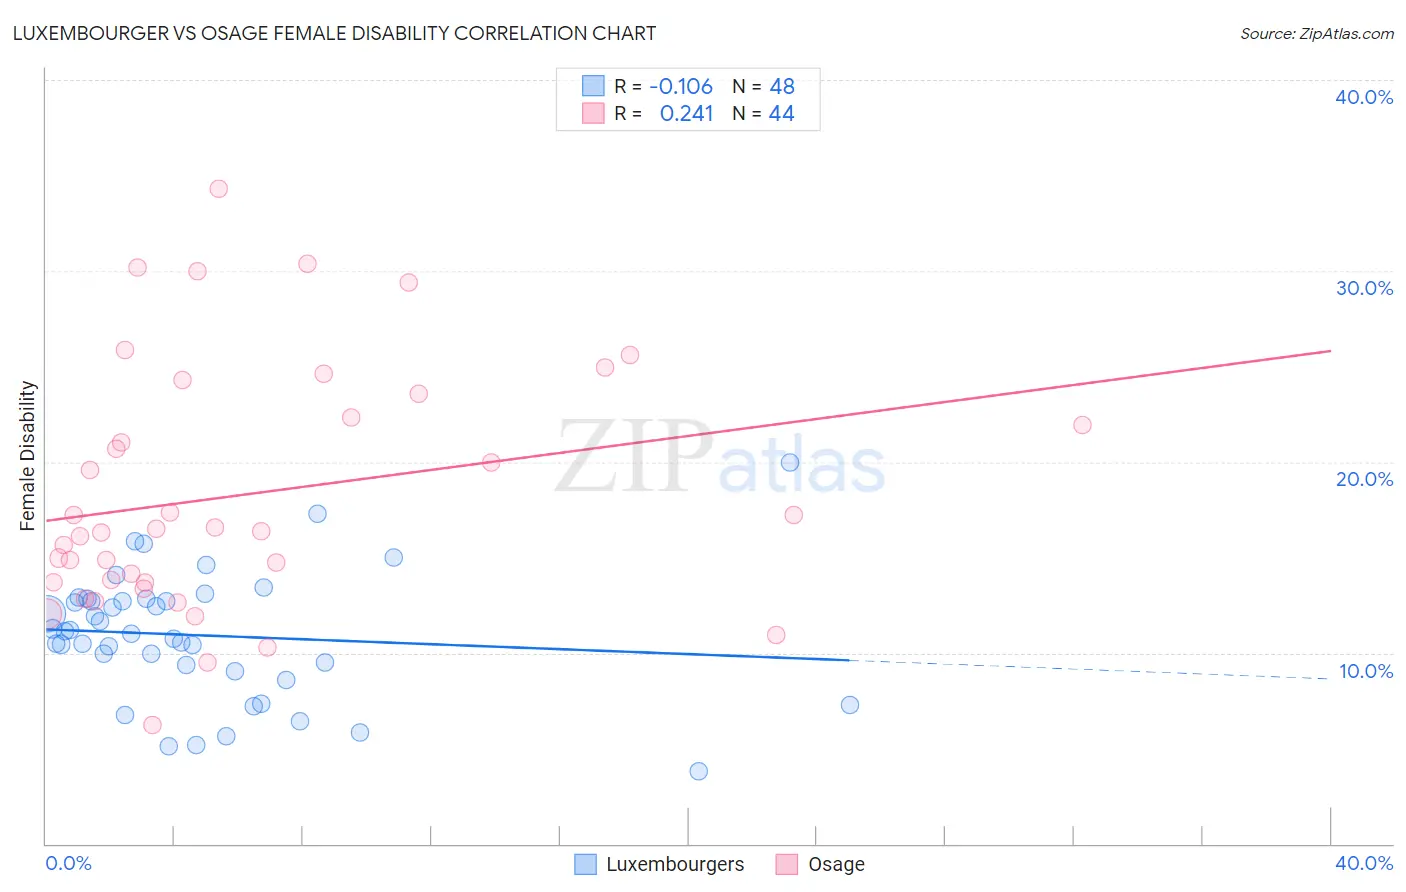
Luxembourger vs Osage Female Disability Correlation Chart
The statistical analysis conducted on geographies consisting of 144,677,023 people shows a poor negative correlation between the proportion of Luxembourgers and percentage of females with a disability in the United States with a correlation coefficient (R) of -0.106 and weighted average of 11.6%. Similarly, the statistical analysis conducted on geographies consisting of 91,799,541 people shows a weak positive correlation between the proportion of Osage and percentage of females with a disability in the United States with a correlation coefficient (R) of 0.241 and weighted average of 14.3%, a difference of 23.7%.
Female Disability Correlation Summary
| Measurement | Luxembourger | Osage |
| Minimum | 3.8% | 6.2% |
| Maximum | 20.0% | 34.3% |
| Range | 16.2% | 28.1% |
| Mean | 10.9% | 18.3% |
| Median | 11.1% | 16.4% |
| Interquartile 25% (IQ1) | 9.2% | 13.7% |
| Interquartile 75% (IQ3) | 12.8% | 22.9% |
| Interquartile Range (IQR) | 3.6% | 9.2% |
| Standard Deviation (Sample) | 3.3% | 6.5% |
| Standard Deviation (Population) | 3.3% | 6.4% |
Similar Demographics by Female Disability
Demographics Similar to Luxembourgers by Female Disability
In terms of female disability, the demographic groups most similar to Luxembourgers are Immigrants from Serbia (11.6%, a difference of 0.020%), Immigrants from Poland (11.6%, a difference of 0.050%), Palestinian (11.6%, a difference of 0.080%), Immigrants from Cameroon (11.6%, a difference of 0.080%), and Immigrants from Denmark (11.6%, a difference of 0.15%).
| Demographics | Rating | Rank | Female Disability |
| Immigrants | Lebanon | 99.7 /100 | #75 | Exceptional 11.5% |
| Immigrants | Eritrea | 99.7 /100 | #76 | Exceptional 11.5% |
| Immigrants | Afghanistan | 99.7 /100 | #77 | Exceptional 11.5% |
| Immigrants | South Africa | 99.7 /100 | #78 | Exceptional 11.5% |
| Sierra Leoneans | 99.7 /100 | #79 | Exceptional 11.5% |
| Immigrants | Jordan | 99.7 /100 | #80 | Exceptional 11.5% |
| Eastern Europeans | 99.7 /100 | #81 | Exceptional 11.5% |
| Luxembourgers | 99.6 /100 | #82 | Exceptional 11.6% |
| Immigrants | Serbia | 99.6 /100 | #83 | Exceptional 11.6% |
| Immigrants | Poland | 99.6 /100 | #84 | Exceptional 11.6% |
| Palestinians | 99.6 /100 | #85 | Exceptional 11.6% |
| Immigrants | Cameroon | 99.6 /100 | #86 | Exceptional 11.6% |
| Immigrants | Denmark | 99.5 /100 | #87 | Exceptional 11.6% |
| Yup'ik | 99.5 /100 | #88 | Exceptional 11.6% |
| Vietnamese | 99.5 /100 | #89 | Exceptional 11.6% |
Demographics Similar to Osage by Female Disability
In terms of female disability, the demographic groups most similar to Osage are Ottawa (14.2%, a difference of 0.43%), Cape Verdean (14.2%, a difference of 0.43%), Comanche (14.2%, a difference of 0.87%), Navajo (14.2%, a difference of 0.98%), and Native/Alaskan (14.1%, a difference of 1.1%).
| Demographics | Rating | Rank | Female Disability |
| Pueblo | 0.0 /100 | #322 | Tragic 14.1% |
| Blacks/African Americans | 0.0 /100 | #323 | Tragic 14.1% |
| Natives/Alaskans | 0.0 /100 | #324 | Tragic 14.1% |
| Navajo | 0.0 /100 | #325 | Tragic 14.2% |
| Comanche | 0.0 /100 | #326 | Tragic 14.2% |
| Ottawa | 0.0 /100 | #327 | Tragic 14.2% |
| Cape Verdeans | 0.0 /100 | #328 | Tragic 14.2% |
| Osage | 0.0 /100 | #329 | Tragic 14.3% |
| Yuman | 0.0 /100 | #330 | Tragic 14.5% |
| Immigrants | Cabo Verde | 0.0 /100 | #331 | Tragic 14.6% |
| Pima | 0.0 /100 | #332 | Tragic 14.8% |
| Immigrants | Azores | 0.0 /100 | #333 | Tragic 14.9% |
| Cherokee | 0.0 /100 | #334 | Tragic 14.9% |
| Cajuns | 0.0 /100 | #335 | Tragic 14.9% |
| Seminole | 0.0 /100 | #336 | Tragic 15.0% |