Luxembourger vs Mongolian Family Households
COMPARE
Luxembourger
Mongolian
Family Households
Family Households Comparison
Luxembourgers
Mongolians
63.3%
FAMILY HOUSEHOLDS
0.9/ 100
METRIC RATING
256th/ 347
METRIC RANK
62.8%
FAMILY HOUSEHOLDS
0.1/ 100
METRIC RATING
285th/ 347
METRIC RANK
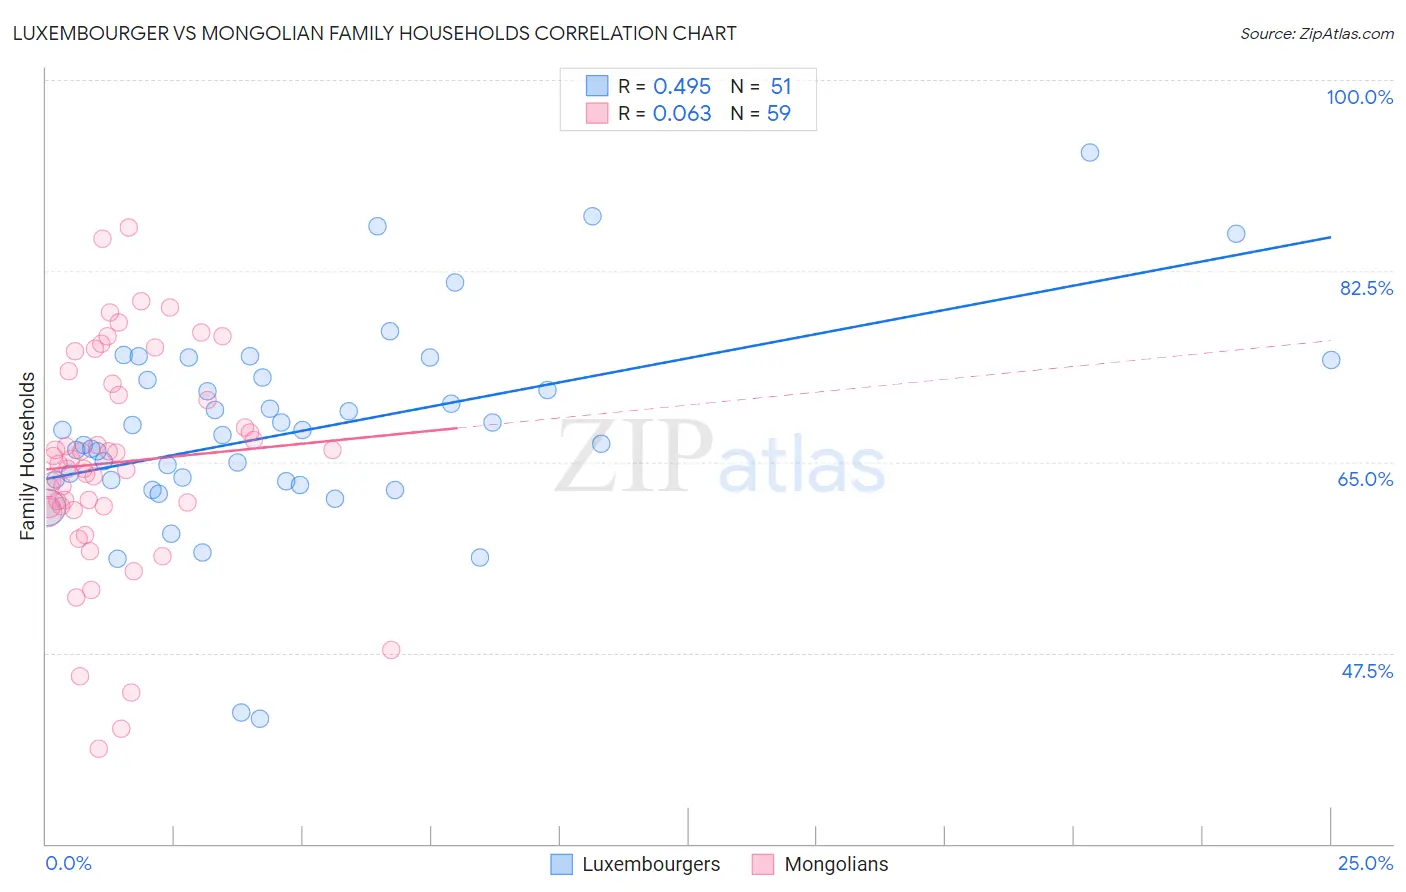
Luxembourger vs Mongolian Family Households Correlation Chart
The statistical analysis conducted on geographies consisting of 144,654,456 people shows a moderate positive correlation between the proportion of Luxembourgers and percentage of family households in the United States with a correlation coefficient (R) of 0.495 and weighted average of 63.3%. Similarly, the statistical analysis conducted on geographies consisting of 140,293,840 people shows a slight positive correlation between the proportion of Mongolians and percentage of family households in the United States with a correlation coefficient (R) of 0.063 and weighted average of 62.8%, a difference of 0.80%.
Family Households Correlation Summary
| Measurement | Luxembourger | Mongolian |
| Minimum | 41.4% | 38.8% |
| Maximum | 93.3% | 86.5% |
| Range | 51.9% | 47.8% |
| Mean | 67.9% | 65.0% |
| Median | 67.5% | 64.9% |
| Interquartile 25% (IQ1) | 63.2% | 60.9% |
| Interquartile 75% (IQ3) | 72.7% | 72.2% |
| Interquartile Range (IQR) | 9.5% | 11.3% |
| Standard Deviation (Sample) | 9.5% | 10.1% |
| Standard Deviation (Population) | 9.4% | 10.0% |
Similar Demographics by Family Households
Demographics Similar to Luxembourgers by Family Households
In terms of family households, the demographic groups most similar to Luxembourgers are Potawatomi (63.3%, a difference of 0.020%), Icelander (63.3%, a difference of 0.040%), Immigrants from Dominican Republic (63.3%, a difference of 0.050%), Slovak (63.3%, a difference of 0.050%), and Bahamian (63.3%, a difference of 0.080%).
| Demographics | Rating | Rank | Family Households |
| Russians | 1.4 /100 | #249 | Tragic 63.4% |
| Immigrants | Japan | 1.4 /100 | #250 | Tragic 63.4% |
| Taiwanese | 1.2 /100 | #251 | Tragic 63.3% |
| Bahamians | 1.1 /100 | #252 | Tragic 63.3% |
| Immigrants | Dominican Republic | 1.0 /100 | #253 | Tragic 63.3% |
| Slovaks | 1.0 /100 | #254 | Tragic 63.3% |
| Potawatomi | 1.0 /100 | #255 | Tragic 63.3% |
| Luxembourgers | 0.9 /100 | #256 | Tragic 63.3% |
| Icelanders | 0.8 /100 | #257 | Tragic 63.3% |
| Immigrants | Barbados | 0.7 /100 | #258 | Tragic 63.2% |
| Immigrants | Western Europe | 0.6 /100 | #259 | Tragic 63.2% |
| Cypriots | 0.6 /100 | #260 | Tragic 63.2% |
| Immigrants | Russia | 0.6 /100 | #261 | Tragic 63.2% |
| Immigrants | Ireland | 0.6 /100 | #262 | Tragic 63.2% |
| Cheyenne | 0.5 /100 | #263 | Tragic 63.2% |
Demographics Similar to Mongolians by Family Households
In terms of family households, the demographic groups most similar to Mongolians are British West Indian (62.8%, a difference of 0.030%), Latvian (62.8%, a difference of 0.030%), Immigrants from Uganda (62.7%, a difference of 0.050%), Australian (62.8%, a difference of 0.10%), and Immigrants from Nepal (62.7%, a difference of 0.14%).
| Demographics | Rating | Rank | Family Households |
| Immigrants | Belgium | 0.2 /100 | #278 | Tragic 63.0% |
| Immigrants | Yemen | 0.2 /100 | #279 | Tragic 63.0% |
| Immigrants | Bulgaria | 0.2 /100 | #280 | Tragic 63.0% |
| Estonians | 0.2 /100 | #281 | Tragic 62.9% |
| New Zealanders | 0.1 /100 | #282 | Tragic 62.9% |
| Immigrants | Denmark | 0.1 /100 | #283 | Tragic 62.9% |
| Australians | 0.1 /100 | #284 | Tragic 62.8% |
| Mongolians | 0.1 /100 | #285 | Tragic 62.8% |
| British West Indians | 0.1 /100 | #286 | Tragic 62.8% |
| Latvians | 0.1 /100 | #287 | Tragic 62.8% |
| Immigrants | Uganda | 0.1 /100 | #288 | Tragic 62.7% |
| Immigrants | Nepal | 0.1 /100 | #289 | Tragic 62.7% |
| Immigrants | Grenada | 0.0 /100 | #290 | Tragic 62.6% |
| U.S. Virgin Islanders | 0.0 /100 | #291 | Tragic 62.6% |
| Immigrants | Burma/Myanmar | 0.0 /100 | #292 | Tragic 62.6% |