Luxembourger vs Pakistani Female Disability
COMPARE
Luxembourger
Pakistani
Female Disability
Female Disability Comparison
Luxembourgers
Pakistanis
11.6%
FEMALE DISABILITY
99.6/ 100
METRIC RATING
82nd/ 347
METRIC RANK
12.0%
FEMALE DISABILITY
84.6/ 100
METRIC RATING
146th/ 347
METRIC RANK
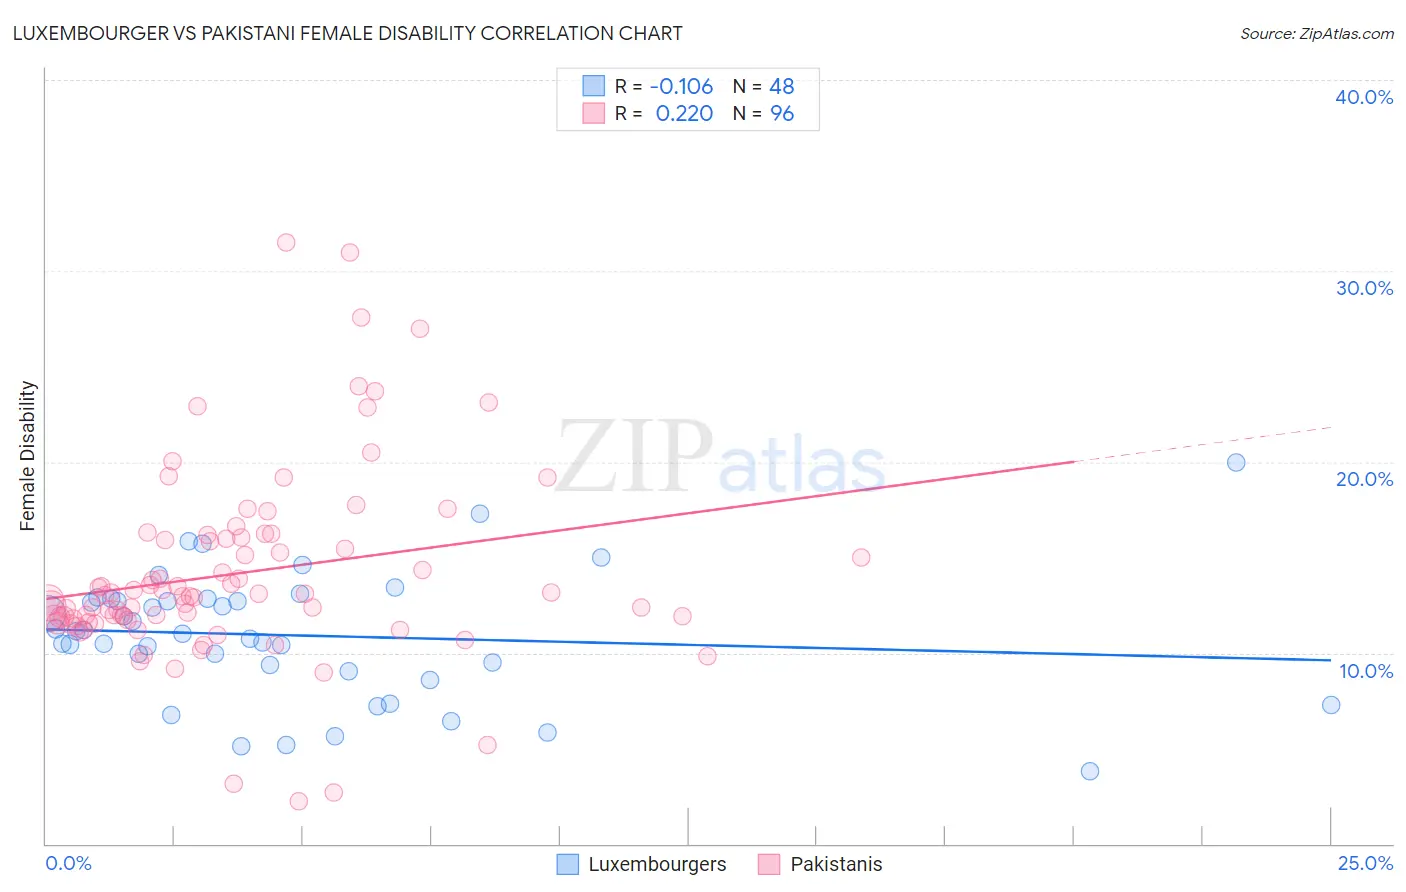
Luxembourger vs Pakistani Female Disability Correlation Chart
The statistical analysis conducted on geographies consisting of 144,677,023 people shows a poor negative correlation between the proportion of Luxembourgers and percentage of females with a disability in the United States with a correlation coefficient (R) of -0.106 and weighted average of 11.6%. Similarly, the statistical analysis conducted on geographies consisting of 335,294,894 people shows a weak positive correlation between the proportion of Pakistanis and percentage of females with a disability in the United States with a correlation coefficient (R) of 0.220 and weighted average of 12.0%, a difference of 3.8%.
Female Disability Correlation Summary
| Measurement | Luxembourger | Pakistani |
| Minimum | 3.8% | 2.2% |
| Maximum | 20.0% | 31.5% |
| Range | 16.2% | 29.3% |
| Mean | 10.9% | 14.2% |
| Median | 11.1% | 13.0% |
| Interquartile 25% (IQ1) | 9.2% | 11.7% |
| Interquartile 75% (IQ3) | 12.8% | 16.0% |
| Interquartile Range (IQR) | 3.6% | 4.3% |
| Standard Deviation (Sample) | 3.3% | 5.0% |
| Standard Deviation (Population) | 3.3% | 5.0% |
Similar Demographics by Female Disability
Demographics Similar to Luxembourgers by Female Disability
In terms of female disability, the demographic groups most similar to Luxembourgers are Immigrants from Serbia (11.6%, a difference of 0.020%), Immigrants from Poland (11.6%, a difference of 0.050%), Palestinian (11.6%, a difference of 0.080%), Immigrants from Cameroon (11.6%, a difference of 0.080%), and Immigrants from Denmark (11.6%, a difference of 0.15%).
| Demographics | Rating | Rank | Female Disability |
| Immigrants | Lebanon | 99.7 /100 | #75 | Exceptional 11.5% |
| Immigrants | Eritrea | 99.7 /100 | #76 | Exceptional 11.5% |
| Immigrants | Afghanistan | 99.7 /100 | #77 | Exceptional 11.5% |
| Immigrants | South Africa | 99.7 /100 | #78 | Exceptional 11.5% |
| Sierra Leoneans | 99.7 /100 | #79 | Exceptional 11.5% |
| Immigrants | Jordan | 99.7 /100 | #80 | Exceptional 11.5% |
| Eastern Europeans | 99.7 /100 | #81 | Exceptional 11.5% |
| Luxembourgers | 99.6 /100 | #82 | Exceptional 11.6% |
| Immigrants | Serbia | 99.6 /100 | #83 | Exceptional 11.6% |
| Immigrants | Poland | 99.6 /100 | #84 | Exceptional 11.6% |
| Palestinians | 99.6 /100 | #85 | Exceptional 11.6% |
| Immigrants | Cameroon | 99.6 /100 | #86 | Exceptional 11.6% |
| Immigrants | Denmark | 99.5 /100 | #87 | Exceptional 11.6% |
| Yup'ik | 99.5 /100 | #88 | Exceptional 11.6% |
| Vietnamese | 99.5 /100 | #89 | Exceptional 11.6% |
Demographics Similar to Pakistanis by Female Disability
In terms of female disability, the demographic groups most similar to Pakistanis are Nigerian (12.0%, a difference of 0.040%), Immigrants from Kenya (12.0%, a difference of 0.11%), Greek (12.0%, a difference of 0.18%), Immigrants from Moldova (12.0%, a difference of 0.21%), and Estonian (12.0%, a difference of 0.26%).
| Demographics | Rating | Rank | Female Disability |
| Immigrants | Hungary | 92.8 /100 | #139 | Exceptional 11.9% |
| Romanians | 91.6 /100 | #140 | Exceptional 11.9% |
| Immigrants | Ecuador | 91.5 /100 | #141 | Exceptional 11.9% |
| Immigrants | Africa | 90.0 /100 | #142 | Excellent 11.9% |
| Immigrants | Sudan | 89.6 /100 | #143 | Excellent 11.9% |
| Immigrants | Austria | 87.9 /100 | #144 | Excellent 12.0% |
| Estonians | 87.8 /100 | #145 | Excellent 12.0% |
| Pakistanis | 84.6 /100 | #146 | Excellent 12.0% |
| Nigerians | 84.0 /100 | #147 | Excellent 12.0% |
| Immigrants | Kenya | 83.1 /100 | #148 | Excellent 12.0% |
| Greeks | 82.0 /100 | #149 | Excellent 12.0% |
| Immigrants | Moldova | 81.4 /100 | #150 | Excellent 12.0% |
| Icelanders | 80.7 /100 | #151 | Excellent 12.0% |
| Immigrants | Scotland | 79.3 /100 | #152 | Good 12.0% |
| Sudanese | 79.1 /100 | #153 | Good 12.0% |