Luxembourger vs Cuban Female Disability
COMPARE
Luxembourger
Cuban
Female Disability
Female Disability Comparison
Luxembourgers
Cubans
11.6%
FEMALE DISABILITY
99.6/ 100
METRIC RATING
82nd/ 347
METRIC RANK
12.3%
FEMALE DISABILITY
36.5/ 100
METRIC RATING
183rd/ 347
METRIC RANK
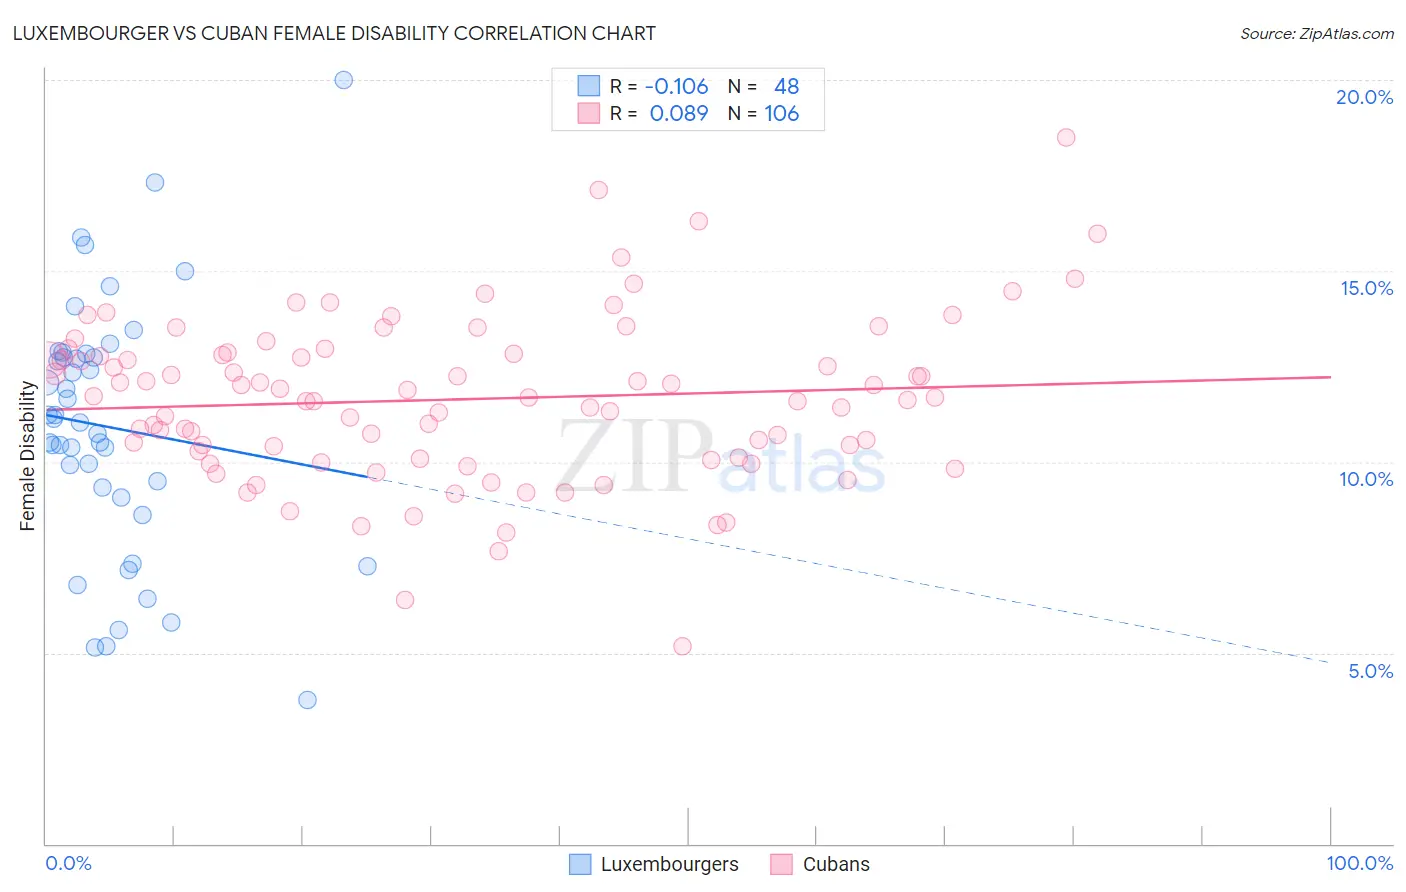
Luxembourger vs Cuban Female Disability Correlation Chart
The statistical analysis conducted on geographies consisting of 144,677,023 people shows a poor negative correlation between the proportion of Luxembourgers and percentage of females with a disability in the United States with a correlation coefficient (R) of -0.106 and weighted average of 11.6%. Similarly, the statistical analysis conducted on geographies consisting of 449,245,212 people shows a slight positive correlation between the proportion of Cubans and percentage of females with a disability in the United States with a correlation coefficient (R) of 0.089 and weighted average of 12.3%, a difference of 6.0%.
Female Disability Correlation Summary
| Measurement | Luxembourger | Cuban |
| Minimum | 3.8% | 5.2% |
| Maximum | 20.0% | 18.5% |
| Range | 16.2% | 13.3% |
| Mean | 10.9% | 11.6% |
| Median | 11.1% | 11.7% |
| Interquartile 25% (IQ1) | 9.2% | 10.1% |
| Interquartile 75% (IQ3) | 12.8% | 12.8% |
| Interquartile Range (IQR) | 3.6% | 2.7% |
| Standard Deviation (Sample) | 3.3% | 2.1% |
| Standard Deviation (Population) | 3.3% | 2.1% |
Similar Demographics by Female Disability
Demographics Similar to Luxembourgers by Female Disability
In terms of female disability, the demographic groups most similar to Luxembourgers are Immigrants from Serbia (11.6%, a difference of 0.020%), Immigrants from Poland (11.6%, a difference of 0.050%), Palestinian (11.6%, a difference of 0.080%), Immigrants from Cameroon (11.6%, a difference of 0.080%), and Immigrants from Denmark (11.6%, a difference of 0.15%).
| Demographics | Rating | Rank | Female Disability |
| Immigrants | Lebanon | 99.7 /100 | #75 | Exceptional 11.5% |
| Immigrants | Eritrea | 99.7 /100 | #76 | Exceptional 11.5% |
| Immigrants | Afghanistan | 99.7 /100 | #77 | Exceptional 11.5% |
| Immigrants | South Africa | 99.7 /100 | #78 | Exceptional 11.5% |
| Sierra Leoneans | 99.7 /100 | #79 | Exceptional 11.5% |
| Immigrants | Jordan | 99.7 /100 | #80 | Exceptional 11.5% |
| Eastern Europeans | 99.7 /100 | #81 | Exceptional 11.5% |
| Luxembourgers | 99.6 /100 | #82 | Exceptional 11.6% |
| Immigrants | Serbia | 99.6 /100 | #83 | Exceptional 11.6% |
| Immigrants | Poland | 99.6 /100 | #84 | Exceptional 11.6% |
| Palestinians | 99.6 /100 | #85 | Exceptional 11.6% |
| Immigrants | Cameroon | 99.6 /100 | #86 | Exceptional 11.6% |
| Immigrants | Denmark | 99.5 /100 | #87 | Exceptional 11.6% |
| Yup'ik | 99.5 /100 | #88 | Exceptional 11.6% |
| Vietnamese | 99.5 /100 | #89 | Exceptional 11.6% |
Demographics Similar to Cubans by Female Disability
In terms of female disability, the demographic groups most similar to Cubans are Norwegian (12.3%, a difference of 0.020%), Iraqi (12.3%, a difference of 0.020%), Immigrants from Canada (12.3%, a difference of 0.030%), Albanian (12.3%, a difference of 0.060%), and Immigrants from Fiji (12.3%, a difference of 0.070%).
| Demographics | Rating | Rank | Female Disability |
| Immigrants | Guyana | 43.1 /100 | #176 | Average 12.2% |
| Immigrants | Ghana | 42.5 /100 | #177 | Average 12.2% |
| Immigrants | Western Europe | 40.9 /100 | #178 | Average 12.2% |
| Immigrants | Fiji | 38.2 /100 | #179 | Fair 12.3% |
| Albanians | 37.9 /100 | #180 | Fair 12.3% |
| Immigrants | Canada | 37.2 /100 | #181 | Fair 12.3% |
| Norwegians | 36.9 /100 | #182 | Fair 12.3% |
| Cubans | 36.5 /100 | #183 | Fair 12.3% |
| Iraqis | 36.0 /100 | #184 | Fair 12.3% |
| Immigrants | Uzbekistan | 33.9 /100 | #185 | Fair 12.3% |
| Austrians | 33.3 /100 | #186 | Fair 12.3% |
| Serbians | 33.1 /100 | #187 | Fair 12.3% |
| Immigrants | North America | 32.8 /100 | #188 | Fair 12.3% |
| Immigrants | Albania | 31.6 /100 | #189 | Fair 12.3% |
| Immigrants | Honduras | 31.3 /100 | #190 | Fair 12.3% |