Luxembourger vs Immigrants from Switzerland Single Mother Poverty
COMPARE
Luxembourger
Immigrants from Switzerland
Single Mother Poverty
Single Mother Poverty Comparison
Luxembourgers
Immigrants from Switzerland
28.5%
SINGLE MOTHER POVERTY
86.4/ 100
METRIC RATING
144th/ 347
METRIC RANK
28.3%
SINGLE MOTHER POVERTY
91.7/ 100
METRIC RATING
124th/ 347
METRIC RANK
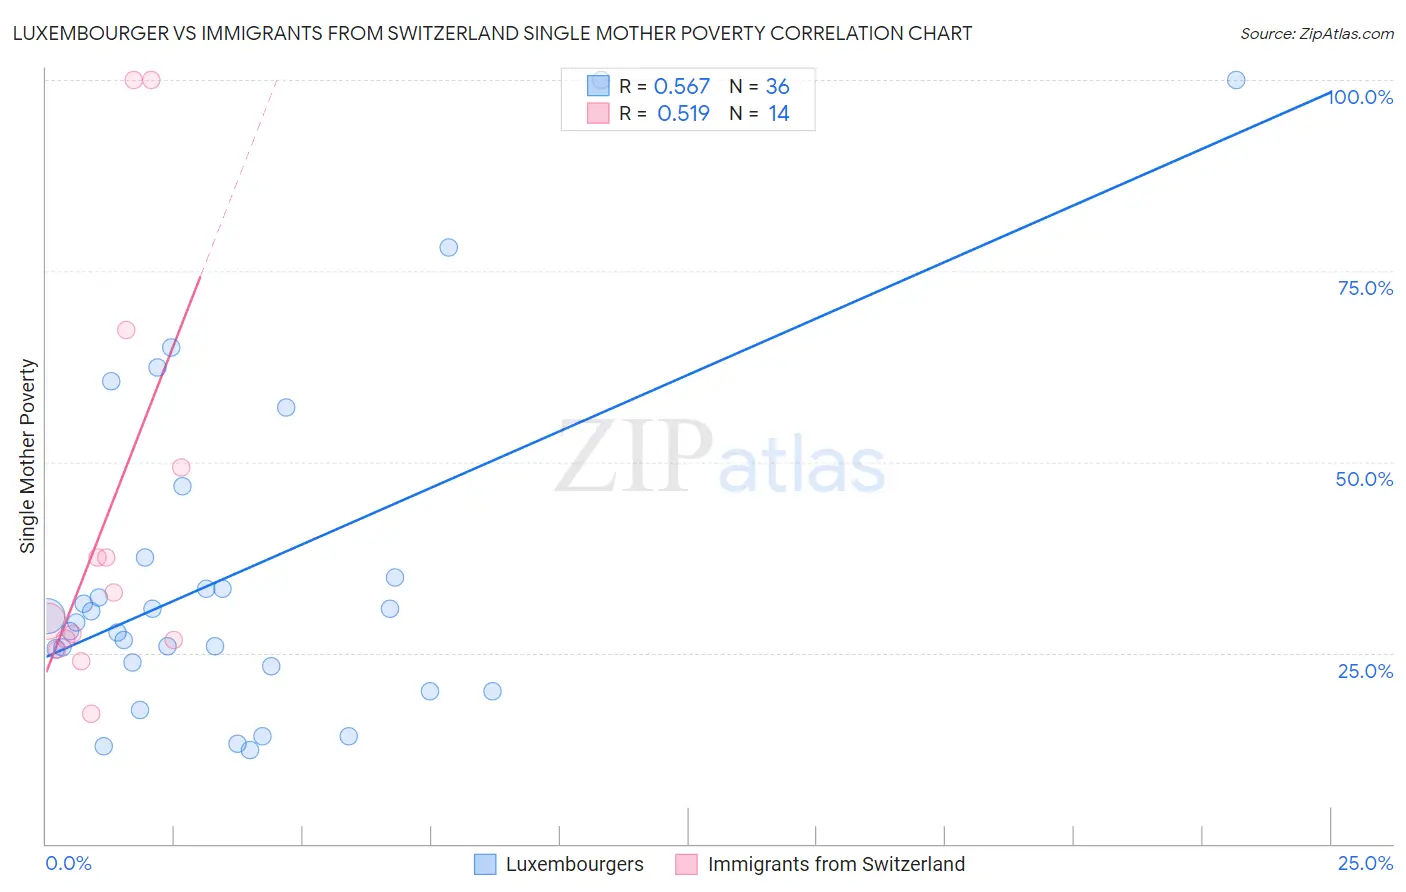
Luxembourger vs Immigrants from Switzerland Single Mother Poverty Correlation Chart
The statistical analysis conducted on geographies consisting of 142,536,891 people shows a substantial positive correlation between the proportion of Luxembourgers and poverty level among single mothers in the United States with a correlation coefficient (R) of 0.567 and weighted average of 28.5%. Similarly, the statistical analysis conducted on geographies consisting of 145,488,343 people shows a substantial positive correlation between the proportion of Immigrants from Switzerland and poverty level among single mothers in the United States with a correlation coefficient (R) of 0.519 and weighted average of 28.3%, a difference of 0.67%.
Single Mother Poverty Correlation Summary
| Measurement | Luxembourger | Immigrants from Switzerland |
| Minimum | 12.2% | 17.0% |
| Maximum | 100.0% | 100.0% |
| Range | 87.8% | 83.0% |
| Mean | 35.5% | 42.9% |
| Median | 29.4% | 31.0% |
| Interquartile 25% (IQ1) | 23.5% | 26.7% |
| Interquartile 75% (IQ3) | 36.2% | 49.2% |
| Interquartile Range (IQR) | 12.7% | 22.5% |
| Standard Deviation (Sample) | 22.2% | 27.2% |
| Standard Deviation (Population) | 21.9% | 26.2% |
Demographics Similar to Luxembourgers and Immigrants from Switzerland by Single Mother Poverty
In terms of single mother poverty, the demographic groups most similar to Luxembourgers are Immigrants from North America (28.5%, a difference of 0.010%), South African (28.5%, a difference of 0.020%), Danish (28.5%, a difference of 0.070%), Immigrants from Colombia (28.5%, a difference of 0.17%), and Samoan (28.5%, a difference of 0.18%). Similarly, the demographic groups most similar to Immigrants from Switzerland are Kenyan (28.4%, a difference of 0.12%), Immigrants from Chile (28.4%, a difference of 0.13%), Polish (28.4%, a difference of 0.14%), Immigrants from England (28.4%, a difference of 0.17%), and South American (28.4%, a difference of 0.20%).
| Demographics | Rating | Rank | Single Mother Poverty |
| Immigrants | Switzerland | 91.7 /100 | #124 | Exceptional 28.3% |
| Kenyans | 90.9 /100 | #125 | Exceptional 28.4% |
| Immigrants | Chile | 90.8 /100 | #126 | Exceptional 28.4% |
| Poles | 90.8 /100 | #127 | Exceptional 28.4% |
| Immigrants | England | 90.5 /100 | #128 | Exceptional 28.4% |
| South Americans | 90.4 /100 | #129 | Exceptional 28.4% |
| Norwegians | 90.4 /100 | #130 | Exceptional 28.4% |
| Immigrants | Austria | 90.3 /100 | #131 | Exceptional 28.4% |
| Immigrants | Morocco | 89.5 /100 | #132 | Excellent 28.4% |
| Swedes | 89.4 /100 | #133 | Excellent 28.4% |
| Immigrants | Southern Europe | 89.2 /100 | #134 | Excellent 28.4% |
| Immigrants | Spain | 89.2 /100 | #135 | Excellent 28.4% |
| Native Hawaiians | 88.9 /100 | #136 | Excellent 28.4% |
| Immigrants | Canada | 88.9 /100 | #137 | Excellent 28.4% |
| Immigrants | Belgium | 88.5 /100 | #138 | Excellent 28.5% |
| Samoans | 88.1 /100 | #139 | Excellent 28.5% |
| Immigrants | Colombia | 88.0 /100 | #140 | Excellent 28.5% |
| Danes | 87.1 /100 | #141 | Excellent 28.5% |
| South Africans | 86.6 /100 | #142 | Excellent 28.5% |
| Immigrants | North America | 86.5 /100 | #143 | Excellent 28.5% |
| Luxembourgers | 86.4 /100 | #144 | Excellent 28.5% |