Luxembourger vs Immigrants from Pakistan Ambulatory Disability
COMPARE
Luxembourger
Immigrants from Pakistan
Ambulatory Disability
Ambulatory Disability Comparison
Luxembourgers
Immigrants from Pakistan
5.6%
AMBULATORY DISABILITY
99.9/ 100
METRIC RATING
50th/ 347
METRIC RANK
5.5%
AMBULATORY DISABILITY
100.0/ 100
METRIC RATING
33rd/ 347
METRIC RANK
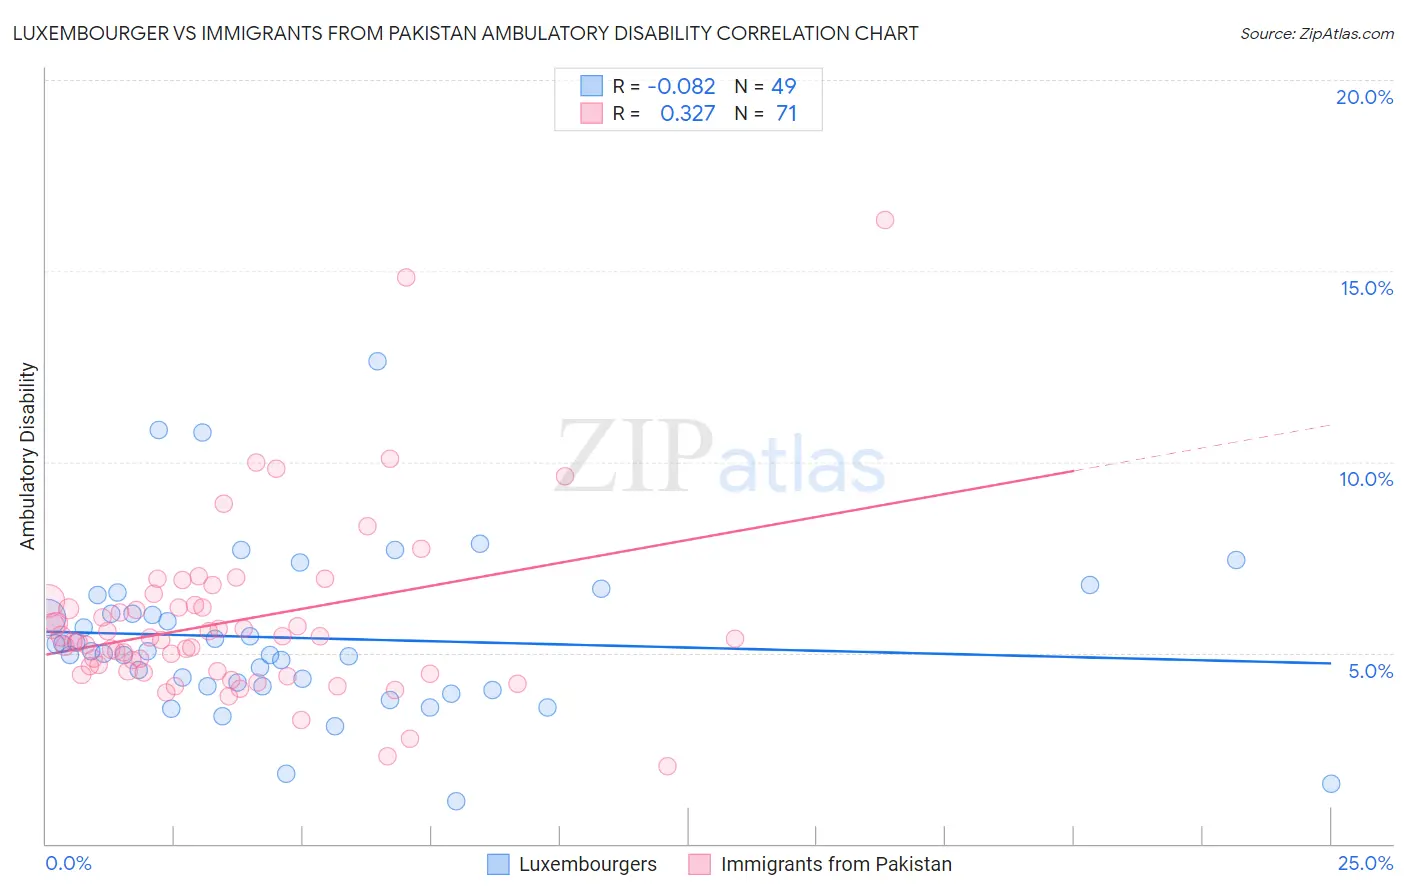
Luxembourger vs Immigrants from Pakistan Ambulatory Disability Correlation Chart
The statistical analysis conducted on geographies consisting of 144,679,340 people shows a slight negative correlation between the proportion of Luxembourgers and percentage of population with ambulatory disability in the United States with a correlation coefficient (R) of -0.082 and weighted average of 5.6%. Similarly, the statistical analysis conducted on geographies consisting of 283,855,056 people shows a mild positive correlation between the proportion of Immigrants from Pakistan and percentage of population with ambulatory disability in the United States with a correlation coefficient (R) of 0.327 and weighted average of 5.5%, a difference of 2.3%.
Ambulatory Disability Correlation Summary
| Measurement | Luxembourger | Immigrants from Pakistan |
| Minimum | 1.1% | 2.0% |
| Maximum | 12.6% | 16.3% |
| Range | 11.5% | 14.3% |
| Mean | 5.4% | 5.8% |
| Median | 5.0% | 5.4% |
| Interquartile 25% (IQ1) | 4.1% | 4.5% |
| Interquartile 75% (IQ3) | 6.3% | 6.2% |
| Interquartile Range (IQR) | 2.1% | 1.7% |
| Standard Deviation (Sample) | 2.2% | 2.3% |
| Standard Deviation (Population) | 2.1% | 2.3% |
Demographics Similar to Luxembourgers and Immigrants from Pakistan by Ambulatory Disability
In terms of ambulatory disability, the demographic groups most similar to Luxembourgers are Taiwanese (5.6%, a difference of 0.10%), Bulgarian (5.6%, a difference of 0.34%), Immigrants from Argentina (5.6%, a difference of 0.54%), Immigrants from Japan (5.6%, a difference of 0.55%), and Immigrants from Sweden (5.6%, a difference of 0.56%). Similarly, the demographic groups most similar to Immigrants from Pakistan are Immigrants from Australia (5.5%, a difference of 0.12%), Immigrants from Asia (5.5%, a difference of 0.16%), Afghan (5.5%, a difference of 0.20%), Immigrants from Malaysia (5.5%, a difference of 0.27%), and Turkish (5.5%, a difference of 0.28%).
| Demographics | Rating | Rank | Ambulatory Disability |
| Immigrants | Venezuela | 100.0 /100 | #31 | Exceptional 5.4% |
| Immigrants | Australia | 100.0 /100 | #32 | Exceptional 5.5% |
| Immigrants | Pakistan | 100.0 /100 | #33 | Exceptional 5.5% |
| Immigrants | Asia | 100.0 /100 | #34 | Exceptional 5.5% |
| Afghans | 100.0 /100 | #35 | Exceptional 5.5% |
| Immigrants | Malaysia | 100.0 /100 | #36 | Exceptional 5.5% |
| Turks | 100.0 /100 | #37 | Exceptional 5.5% |
| Cypriots | 100.0 /100 | #38 | Exceptional 5.5% |
| Immigrants | Eritrea | 100.0 /100 | #39 | Exceptional 5.5% |
| Venezuelans | 99.9 /100 | #40 | Exceptional 5.5% |
| Mongolians | 99.9 /100 | #41 | Exceptional 5.5% |
| Argentineans | 99.9 /100 | #42 | Exceptional 5.5% |
| Paraguayans | 99.9 /100 | #43 | Exceptional 5.5% |
| Immigrants | Indonesia | 99.9 /100 | #44 | Exceptional 5.5% |
| Immigrants | Sweden | 99.9 /100 | #45 | Exceptional 5.6% |
| Egyptians | 99.9 /100 | #46 | Exceptional 5.6% |
| Immigrants | Japan | 99.9 /100 | #47 | Exceptional 5.6% |
| Immigrants | Argentina | 99.9 /100 | #48 | Exceptional 5.6% |
| Bulgarians | 99.9 /100 | #49 | Exceptional 5.6% |
| Luxembourgers | 99.9 /100 | #50 | Exceptional 5.6% |
| Taiwanese | 99.8 /100 | #51 | Exceptional 5.6% |