Immigrants from Eastern Europe vs Immigrants from Haiti Male Disability
COMPARE
Immigrants from Eastern Europe
Immigrants from Haiti
Male Disability
Male Disability Comparison
Immigrants from Eastern Europe
Immigrants from Haiti
10.7%
MALE DISABILITY
95.3/ 100
METRIC RATING
102nd/ 347
METRIC RANK
11.1%
MALE DISABILITY
65.3/ 100
METRIC RATING
162nd/ 347
METRIC RANK
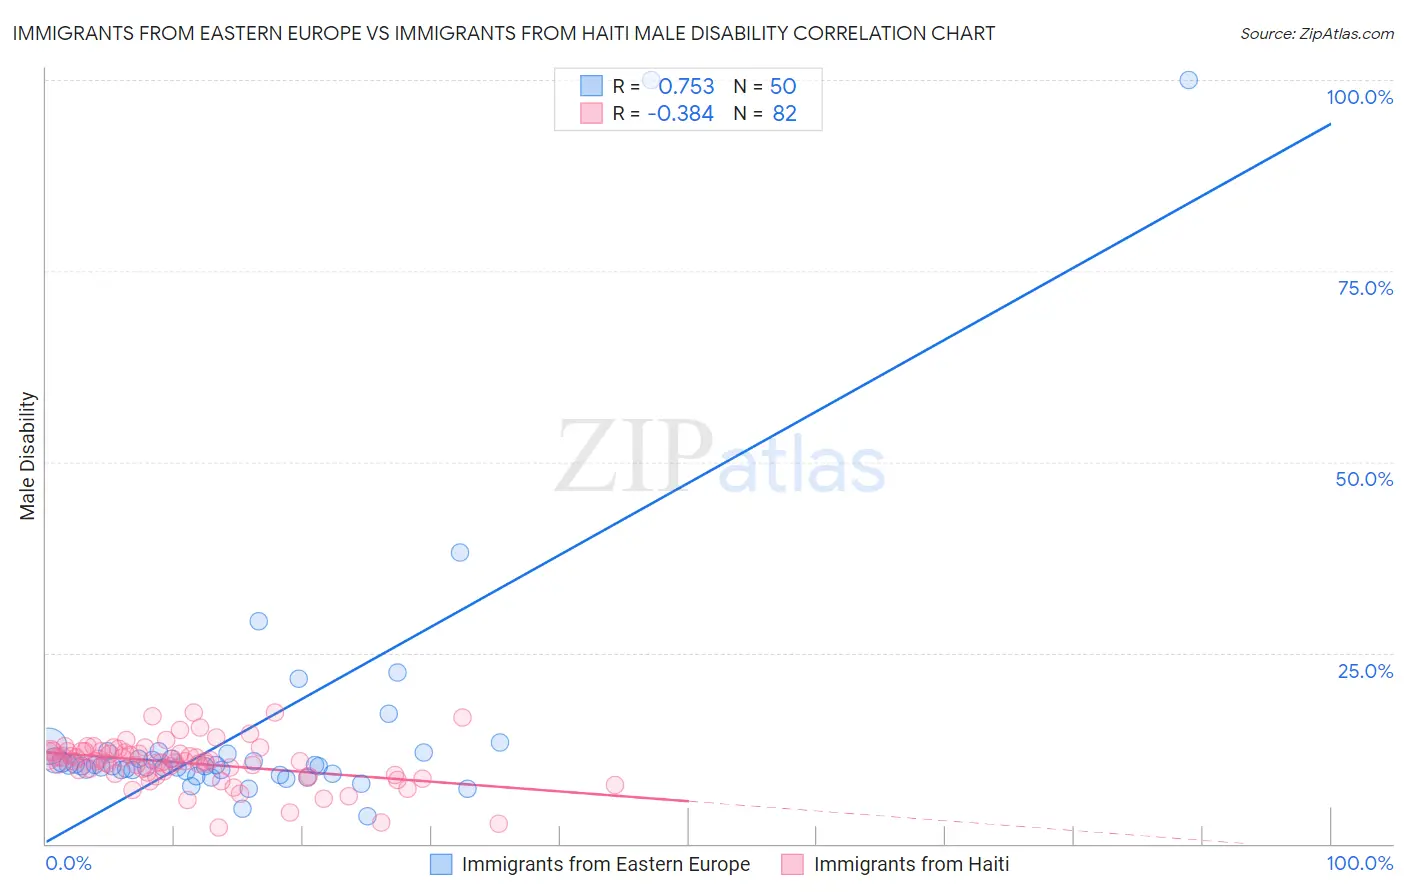
Immigrants from Eastern Europe vs Immigrants from Haiti Male Disability Correlation Chart
The statistical analysis conducted on geographies consisting of 475,764,615 people shows a strong positive correlation between the proportion of Immigrants from Eastern Europe and percentage of males with a disability in the United States with a correlation coefficient (R) of 0.753 and weighted average of 10.7%. Similarly, the statistical analysis conducted on geographies consisting of 225,231,442 people shows a mild negative correlation between the proportion of Immigrants from Haiti and percentage of males with a disability in the United States with a correlation coefficient (R) of -0.384 and weighted average of 11.1%, a difference of 3.4%.
Male Disability Correlation Summary
| Measurement | Immigrants from Eastern Europe | Immigrants from Haiti |
| Minimum | 3.6% | 2.1% |
| Maximum | 100.0% | 17.2% |
| Range | 96.4% | 15.1% |
| Mean | 15.0% | 10.6% |
| Median | 10.2% | 10.8% |
| Interquartile 25% (IQ1) | 9.6% | 9.2% |
| Interquartile 75% (IQ3) | 11.8% | 12.1% |
| Interquartile Range (IQR) | 2.3% | 2.8% |
| Standard Deviation (Sample) | 18.4% | 2.9% |
| Standard Deviation (Population) | 18.2% | 2.9% |
Similar Demographics by Male Disability
Demographics Similar to Immigrants from Eastern Europe by Male Disability
In terms of male disability, the demographic groups most similar to Immigrants from Eastern Europe are Uruguayan (10.7%, a difference of 0.010%), Immigrants from Nigeria (10.8%, a difference of 0.080%), Immigrants from Brazil (10.8%, a difference of 0.090%), Immigrants from Greece (10.7%, a difference of 0.10%), and Immigrants from Syria (10.8%, a difference of 0.13%).
| Demographics | Rating | Rank | Male Disability |
| Chileans | 96.9 /100 | #95 | Exceptional 10.7% |
| Nicaraguans | 96.6 /100 | #96 | Exceptional 10.7% |
| Immigrants | Armenia | 96.6 /100 | #97 | Exceptional 10.7% |
| Immigrants | Romania | 96.5 /100 | #98 | Exceptional 10.7% |
| Immigrants | Switzerland | 96.1 /100 | #99 | Exceptional 10.7% |
| Immigrants | Kazakhstan | 95.9 /100 | #100 | Exceptional 10.7% |
| Immigrants | Greece | 95.6 /100 | #101 | Exceptional 10.7% |
| Immigrants | Eastern Europe | 95.3 /100 | #102 | Exceptional 10.7% |
| Uruguayans | 95.3 /100 | #103 | Exceptional 10.7% |
| Immigrants | Nigeria | 95.1 /100 | #104 | Exceptional 10.8% |
| Immigrants | Brazil | 95.0 /100 | #105 | Exceptional 10.8% |
| Immigrants | Syria | 94.9 /100 | #106 | Exceptional 10.8% |
| Immigrants | Eastern Africa | 94.3 /100 | #107 | Exceptional 10.8% |
| Immigrants | Belgium | 94.2 /100 | #108 | Exceptional 10.8% |
| Immigrants | Uganda | 94.0 /100 | #109 | Exceptional 10.8% |
Demographics Similar to Immigrants from Haiti by Male Disability
In terms of male disability, the demographic groups most similar to Immigrants from Haiti are Immigrants from West Indies (11.1%, a difference of 0.020%), Albanian (11.1%, a difference of 0.070%), Immigrants from Kenya (11.1%, a difference of 0.090%), Guatemalan (11.1%, a difference of 0.12%), and British West Indian (11.1%, a difference of 0.15%).
| Demographics | Rating | Rank | Male Disability |
| Immigrants | Middle Africa | 70.9 /100 | #155 | Good 11.1% |
| Russians | 69.8 /100 | #156 | Good 11.1% |
| Immigrants | Western Africa | 69.2 /100 | #157 | Good 11.1% |
| Latvians | 68.1 /100 | #158 | Good 11.1% |
| Guatemalans | 67.2 /100 | #159 | Good 11.1% |
| Albanians | 66.5 /100 | #160 | Good 11.1% |
| Immigrants | West Indies | 65.7 /100 | #161 | Good 11.1% |
| Immigrants | Haiti | 65.3 /100 | #162 | Good 11.1% |
| Immigrants | Kenya | 63.8 /100 | #163 | Good 11.1% |
| British West Indians | 62.8 /100 | #164 | Good 11.1% |
| Luxembourgers | 61.9 /100 | #165 | Good 11.1% |
| Immigrants | Hungary | 61.2 /100 | #166 | Good 11.1% |
| Immigrants | Southern Europe | 54.4 /100 | #167 | Average 11.2% |
| Immigrants | Latin America | 54.0 /100 | #168 | Average 11.2% |
| Barbadians | 53.4 /100 | #169 | Average 11.2% |