Lumbee vs Immigrants from Dominican Republic Unemployment Among Ages 25 to 29 years
COMPARE
Lumbee
Immigrants from Dominican Republic
Unemployment Among Ages 25 to 29 years
Unemployment Among Ages 25 to 29 years Comparison
Lumbee
Immigrants from Dominican Republic
11.2%
UNEMPLOYMENT AMONG AGES 25 TO 29 YEARS
0.0/ 100
METRIC RATING
336th/ 347
METRIC RANK
8.6%
UNEMPLOYMENT AMONG AGES 25 TO 29 YEARS
0.0/ 100
METRIC RATING
321st/ 347
METRIC RANK
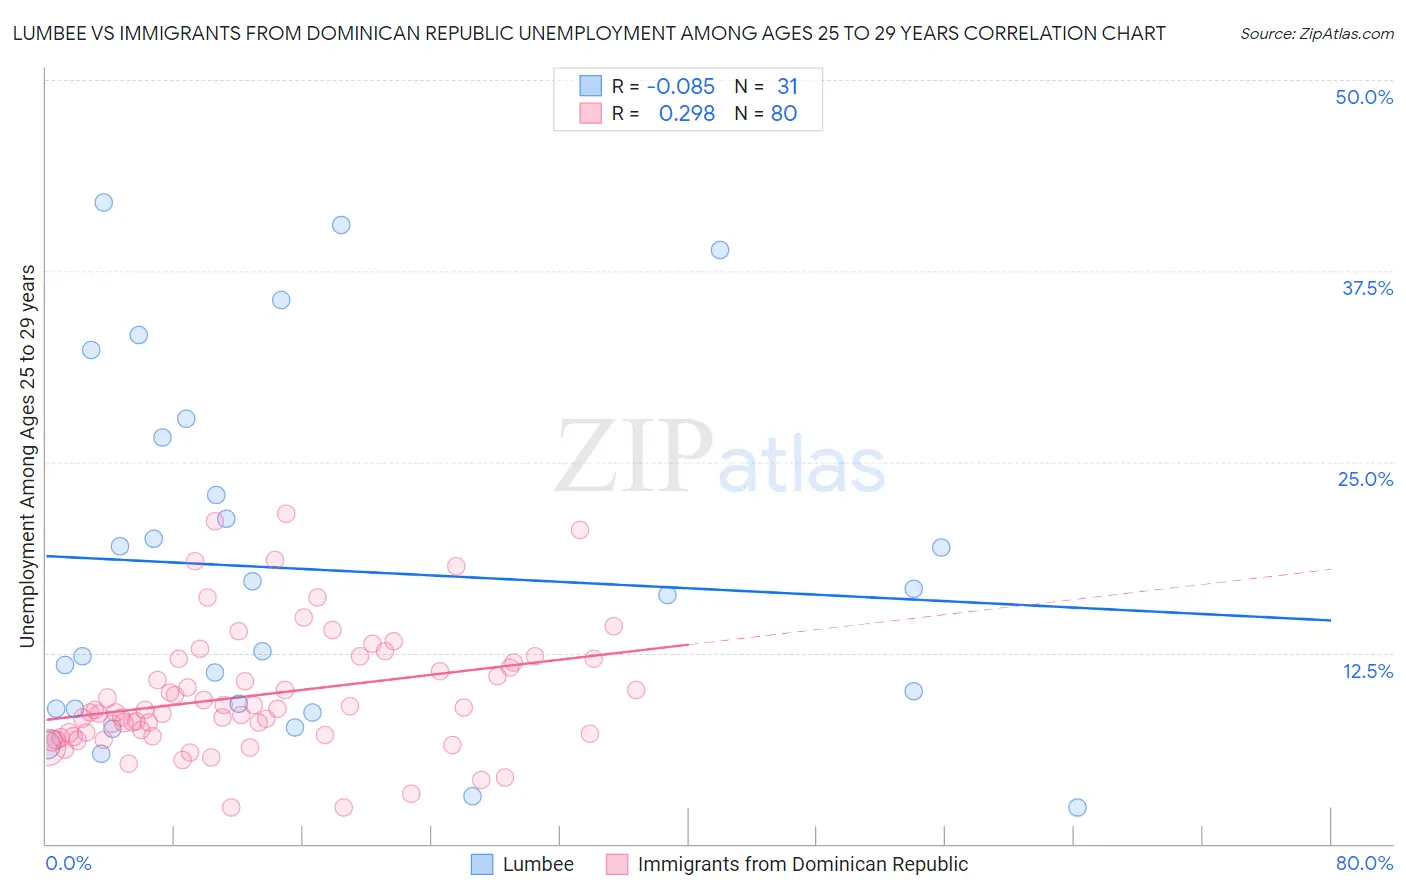
Lumbee vs Immigrants from Dominican Republic Unemployment Among Ages 25 to 29 years Correlation Chart
The statistical analysis conducted on geographies consisting of 90,454,801 people shows a slight negative correlation between the proportion of Lumbee and unemployment rate among population between the ages 25 and 29 in the United States with a correlation coefficient (R) of -0.085 and weighted average of 11.2%. Similarly, the statistical analysis conducted on geographies consisting of 264,956,049 people shows a weak positive correlation between the proportion of Immigrants from Dominican Republic and unemployment rate among population between the ages 25 and 29 in the United States with a correlation coefficient (R) of 0.298 and weighted average of 8.6%, a difference of 30.5%.
Unemployment Among Ages 25 to 29 years Correlation Summary
| Measurement | Lumbee | Immigrants from Dominican Republic |
| Minimum | 2.4% | 2.4% |
| Maximum | 42.0% | 21.6% |
| Range | 39.6% | 19.2% |
| Mean | 17.9% | 9.7% |
| Median | 16.3% | 8.7% |
| Interquartile 25% (IQ1) | 8.8% | 7.1% |
| Interquartile 75% (IQ3) | 26.6% | 12.0% |
| Interquartile Range (IQR) | 17.8% | 4.9% |
| Standard Deviation (Sample) | 11.5% | 4.1% |
| Standard Deviation (Population) | 11.4% | 4.0% |
Demographics Similar to Lumbee and Immigrants from Dominican Republic by Unemployment Among Ages 25 to 29 years
In terms of unemployment among ages 25 to 29 years, the demographic groups most similar to Lumbee are Menominee (11.3%, a difference of 0.28%), Puerto Rican (11.1%, a difference of 1.1%), Yuman (11.0%, a difference of 2.2%), Sioux (11.7%, a difference of 3.8%), and Alaskan Athabascan (10.8%, a difference of 4.2%). Similarly, the demographic groups most similar to Immigrants from Dominican Republic are Black/African American (8.6%, a difference of 0.61%), Tlingit-Haida (8.7%, a difference of 0.78%), Dominican (8.7%, a difference of 0.88%), Houma (8.7%, a difference of 1.2%), and Immigrants from Armenia (8.5%, a difference of 1.4%).
| Demographics | Rating | Rank | Unemployment Among Ages 25 to 29 years |
| Guyanese | 0.0 /100 | #318 | Tragic 8.5% |
| Immigrants | Armenia | 0.0 /100 | #319 | Tragic 8.5% |
| Blacks/African Americans | 0.0 /100 | #320 | Tragic 8.6% |
| Immigrants | Dominican Republic | 0.0 /100 | #321 | Tragic 8.6% |
| Tlingit-Haida | 0.0 /100 | #322 | Tragic 8.7% |
| Dominicans | 0.0 /100 | #323 | Tragic 8.7% |
| Houma | 0.0 /100 | #324 | Tragic 8.7% |
| Yakama | 0.0 /100 | #325 | Tragic 8.8% |
| Shoshone | 0.0 /100 | #326 | Tragic 9.2% |
| Colville | 0.0 /100 | #327 | Tragic 9.2% |
| Apache | 0.0 /100 | #328 | Tragic 9.5% |
| Aleuts | 0.0 /100 | #329 | Tragic 9.7% |
| Natives/Alaskans | 0.0 /100 | #330 | Tragic 9.8% |
| Alaska Natives | 0.0 /100 | #331 | Tragic 10.2% |
| Pueblo | 0.0 /100 | #332 | Tragic 10.4% |
| Alaskan Athabascans | 0.0 /100 | #333 | Tragic 10.8% |
| Yuman | 0.0 /100 | #334 | Tragic 11.0% |
| Puerto Ricans | 0.0 /100 | #335 | Tragic 11.1% |
| Lumbee | 0.0 /100 | #336 | Tragic 11.2% |
| Menominee | 0.0 /100 | #337 | Tragic 11.3% |
| Sioux | 0.0 /100 | #338 | Tragic 11.7% |