Lumbee vs Immigrants from Congo Female Disability
COMPARE
Lumbee
Immigrants from Congo
Female Disability
Female Disability Comparison
Lumbee
Immigrants from Congo
15.8%
FEMALE DISABILITY
0.0/ 100
METRIC RATING
343rd/ 347
METRIC RANK
12.7%
FEMALE DISABILITY
1.8/ 100
METRIC RATING
249th/ 347
METRIC RANK
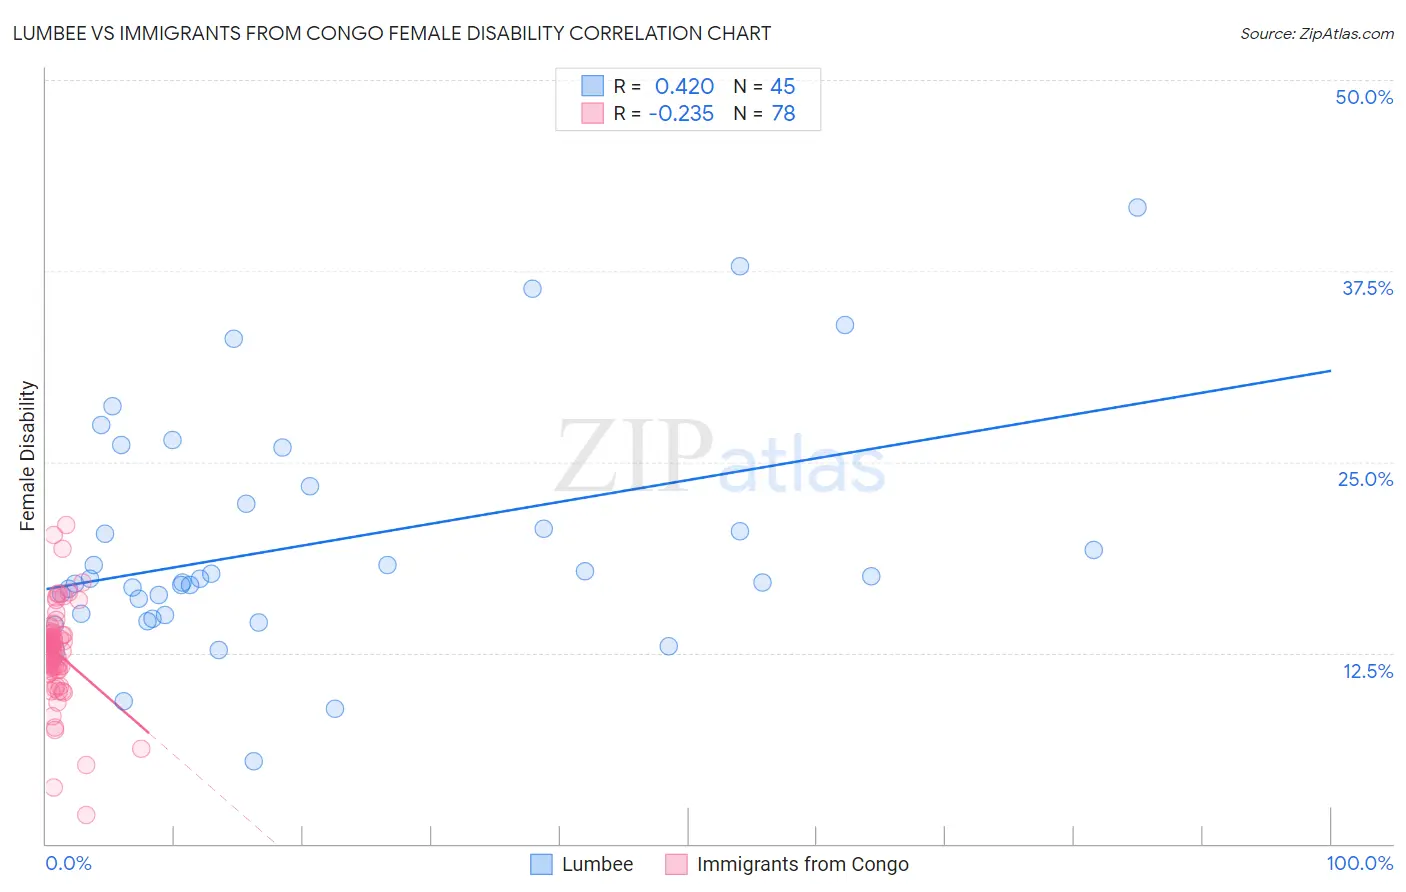
Lumbee vs Immigrants from Congo Female Disability Correlation Chart
The statistical analysis conducted on geographies consisting of 92,288,474 people shows a moderate positive correlation between the proportion of Lumbee and percentage of females with a disability in the United States with a correlation coefficient (R) of 0.420 and weighted average of 15.8%. Similarly, the statistical analysis conducted on geographies consisting of 92,114,824 people shows a weak negative correlation between the proportion of Immigrants from Congo and percentage of females with a disability in the United States with a correlation coefficient (R) of -0.235 and weighted average of 12.7%, a difference of 24.6%.
Female Disability Correlation Summary
| Measurement | Lumbee | Immigrants from Congo |
| Minimum | 5.4% | 1.9% |
| Maximum | 41.7% | 20.8% |
| Range | 36.3% | 19.0% |
| Mean | 19.7% | 12.5% |
| Median | 17.4% | 12.8% |
| Interquartile 25% (IQ1) | 15.0% | 11.4% |
| Interquartile 75% (IQ3) | 22.8% | 13.7% |
| Interquartile Range (IQR) | 7.8% | 2.3% |
| Standard Deviation (Sample) | 7.7% | 3.1% |
| Standard Deviation (Population) | 7.6% | 3.1% |
Similar Demographics by Female Disability
Demographics Similar to Lumbee by Female Disability
In terms of female disability, the demographic groups most similar to Lumbee are Kiowa (15.8%, a difference of 0.16%), Creek (15.7%, a difference of 0.68%), Choctaw (15.4%, a difference of 2.3%), Chickasaw (15.2%, a difference of 3.7%), and Colville (15.1%, a difference of 4.7%).
| Demographics | Rating | Rank | Female Disability |
| Immigrants | Azores | 0.0 /100 | #333 | Tragic 14.9% |
| Cherokee | 0.0 /100 | #334 | Tragic 14.9% |
| Cajuns | 0.0 /100 | #335 | Tragic 14.9% |
| Seminole | 0.0 /100 | #336 | Tragic 15.0% |
| Tohono O'odham | 0.0 /100 | #337 | Tragic 15.0% |
| Dutch West Indians | 0.0 /100 | #338 | Tragic 15.0% |
| Colville | 0.0 /100 | #339 | Tragic 15.1% |
| Chickasaw | 0.0 /100 | #340 | Tragic 15.2% |
| Choctaw | 0.0 /100 | #341 | Tragic 15.4% |
| Creek | 0.0 /100 | #342 | Tragic 15.7% |
| Lumbee | 0.0 /100 | #343 | Tragic 15.8% |
| Kiowa | 0.0 /100 | #344 | Tragic 15.8% |
| Puerto Ricans | 0.0 /100 | #345 | Tragic 16.6% |
| Tsimshian | 0.0 /100 | #346 | Tragic 16.8% |
| Houma | 0.0 /100 | #347 | Tragic 16.9% |
Demographics Similar to Immigrants from Congo by Female Disability
In terms of female disability, the demographic groups most similar to Immigrants from Congo are Slovene (12.7%, a difference of 0.040%), Crow (12.7%, a difference of 0.10%), Carpatho Rusyn (12.6%, a difference of 0.13%), Menominee (12.6%, a difference of 0.16%), and Spanish American Indian (12.6%, a difference of 0.18%).
| Demographics | Rating | Rank | Female Disability |
| Canadians | 2.6 /100 | #242 | Tragic 12.6% |
| Immigrants | Senegal | 2.5 /100 | #243 | Tragic 12.6% |
| Alsatians | 2.5 /100 | #244 | Tragic 12.6% |
| Immigrants | Jamaica | 2.2 /100 | #245 | Tragic 12.6% |
| Spanish American Indians | 2.1 /100 | #246 | Tragic 12.6% |
| Menominee | 2.1 /100 | #247 | Tragic 12.6% |
| Carpatho Rusyns | 2.0 /100 | #248 | Tragic 12.6% |
| Immigrants | Congo | 1.8 /100 | #249 | Tragic 12.7% |
| Slovenes | 1.7 /100 | #250 | Tragic 12.7% |
| Crow | 1.6 /100 | #251 | Tragic 12.7% |
| Immigrants | Caribbean | 1.4 /100 | #252 | Tragic 12.7% |
| Jamaicans | 1.4 /100 | #253 | Tragic 12.7% |
| Hawaiians | 1.4 /100 | #254 | Tragic 12.7% |
| Immigrants | Germany | 1.3 /100 | #255 | Tragic 12.7% |
| British West Indians | 1.2 /100 | #256 | Tragic 12.7% |