Lumbee vs Greek Female Disability
COMPARE
Lumbee
Greek
Female Disability
Female Disability Comparison
Lumbee
Greeks
15.8%
FEMALE DISABILITY
0.0/ 100
METRIC RATING
343rd/ 347
METRIC RANK
12.0%
FEMALE DISABILITY
82.0/ 100
METRIC RATING
149th/ 347
METRIC RANK
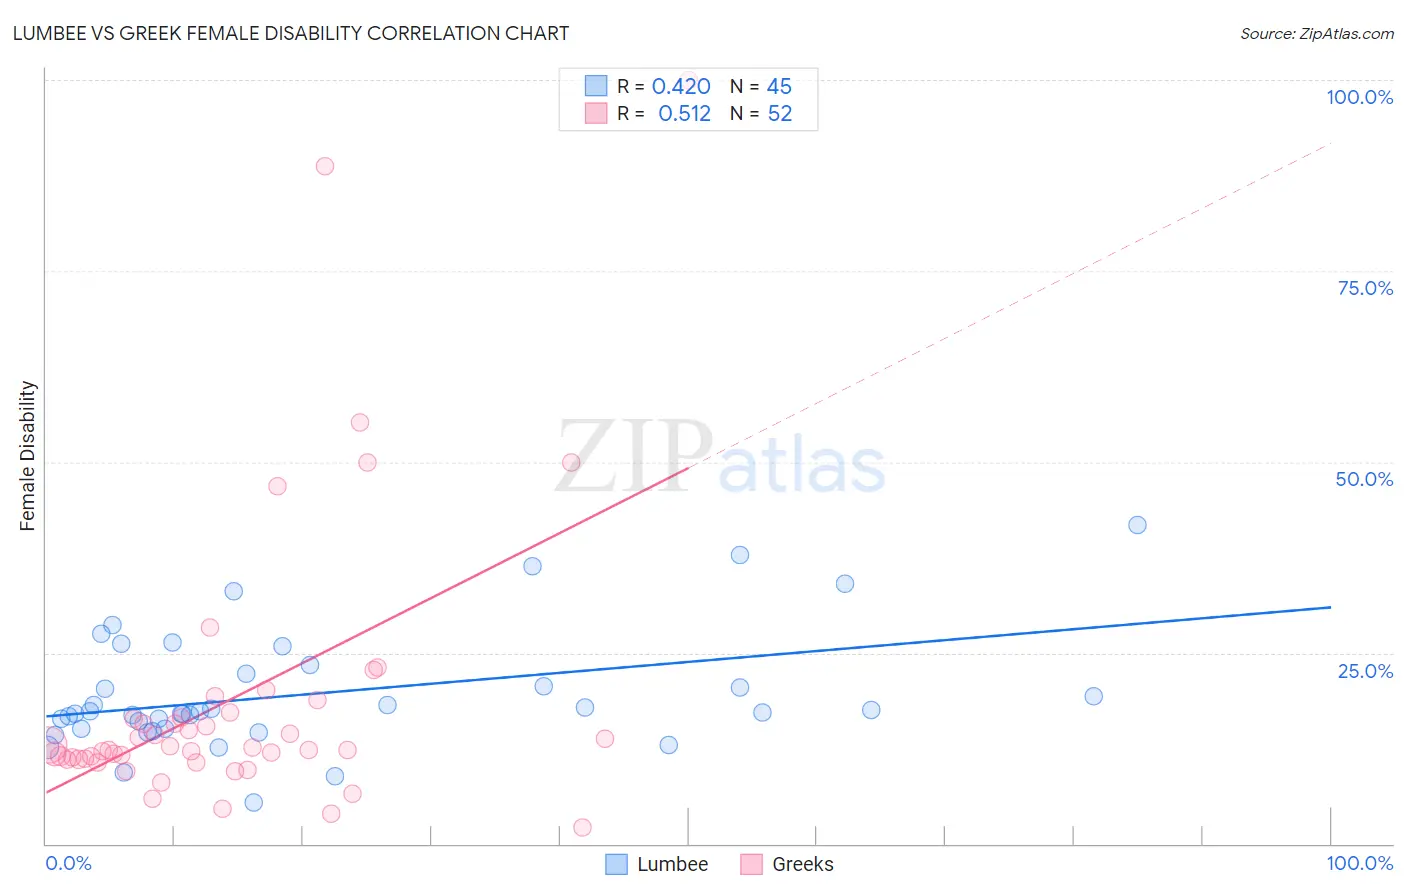
Lumbee vs Greek Female Disability Correlation Chart
The statistical analysis conducted on geographies consisting of 92,288,474 people shows a moderate positive correlation between the proportion of Lumbee and percentage of females with a disability in the United States with a correlation coefficient (R) of 0.420 and weighted average of 15.8%. Similarly, the statistical analysis conducted on geographies consisting of 482,678,475 people shows a substantial positive correlation between the proportion of Greeks and percentage of females with a disability in the United States with a correlation coefficient (R) of 0.512 and weighted average of 12.0%, a difference of 31.2%.
Female Disability Correlation Summary
| Measurement | Lumbee | Greek |
| Minimum | 5.4% | 2.2% |
| Maximum | 41.7% | 100.0% |
| Range | 36.3% | 97.8% |
| Mean | 19.7% | 19.0% |
| Median | 17.4% | 12.5% |
| Interquartile 25% (IQ1) | 15.0% | 11.1% |
| Interquartile 75% (IQ3) | 22.8% | 16.9% |
| Interquartile Range (IQR) | 7.8% | 5.8% |
| Standard Deviation (Sample) | 7.7% | 18.9% |
| Standard Deviation (Population) | 7.6% | 18.7% |
Similar Demographics by Female Disability
Demographics Similar to Lumbee by Female Disability
In terms of female disability, the demographic groups most similar to Lumbee are Kiowa (15.8%, a difference of 0.16%), Creek (15.7%, a difference of 0.68%), Choctaw (15.4%, a difference of 2.3%), Chickasaw (15.2%, a difference of 3.7%), and Colville (15.1%, a difference of 4.7%).
| Demographics | Rating | Rank | Female Disability |
| Immigrants | Azores | 0.0 /100 | #333 | Tragic 14.9% |
| Cherokee | 0.0 /100 | #334 | Tragic 14.9% |
| Cajuns | 0.0 /100 | #335 | Tragic 14.9% |
| Seminole | 0.0 /100 | #336 | Tragic 15.0% |
| Tohono O'odham | 0.0 /100 | #337 | Tragic 15.0% |
| Dutch West Indians | 0.0 /100 | #338 | Tragic 15.0% |
| Colville | 0.0 /100 | #339 | Tragic 15.1% |
| Chickasaw | 0.0 /100 | #340 | Tragic 15.2% |
| Choctaw | 0.0 /100 | #341 | Tragic 15.4% |
| Creek | 0.0 /100 | #342 | Tragic 15.7% |
| Lumbee | 0.0 /100 | #343 | Tragic 15.8% |
| Kiowa | 0.0 /100 | #344 | Tragic 15.8% |
| Puerto Ricans | 0.0 /100 | #345 | Tragic 16.6% |
| Tsimshian | 0.0 /100 | #346 | Tragic 16.8% |
| Houma | 0.0 /100 | #347 | Tragic 16.9% |
Demographics Similar to Greeks by Female Disability
In terms of female disability, the demographic groups most similar to Greeks are Immigrants from Moldova (12.0%, a difference of 0.030%), Immigrants from Kenya (12.0%, a difference of 0.070%), Icelander (12.0%, a difference of 0.080%), Nigerian (12.0%, a difference of 0.14%), and Immigrants from Scotland (12.0%, a difference of 0.16%).
| Demographics | Rating | Rank | Female Disability |
| Immigrants | Africa | 90.0 /100 | #142 | Excellent 11.9% |
| Immigrants | Sudan | 89.6 /100 | #143 | Excellent 11.9% |
| Immigrants | Austria | 87.9 /100 | #144 | Excellent 12.0% |
| Estonians | 87.8 /100 | #145 | Excellent 12.0% |
| Pakistanis | 84.6 /100 | #146 | Excellent 12.0% |
| Nigerians | 84.0 /100 | #147 | Excellent 12.0% |
| Immigrants | Kenya | 83.1 /100 | #148 | Excellent 12.0% |
| Greeks | 82.0 /100 | #149 | Excellent 12.0% |
| Immigrants | Moldova | 81.4 /100 | #150 | Excellent 12.0% |
| Icelanders | 80.7 /100 | #151 | Excellent 12.0% |
| Immigrants | Scotland | 79.3 /100 | #152 | Good 12.0% |
| Sudanese | 79.1 /100 | #153 | Good 12.0% |
| Syrians | 76.9 /100 | #154 | Good 12.1% |
| Ghanaians | 76.6 /100 | #155 | Good 12.1% |
| Moroccans | 72.9 /100 | #156 | Good 12.1% |