Arab vs Immigrants from Congo Female Disability
COMPARE
Arab
Immigrants from Congo
Female Disability
Female Disability Comparison
Arabs
Immigrants from Congo
11.9%
FEMALE DISABILITY
95.1/ 100
METRIC RATING
131st/ 347
METRIC RANK
12.7%
FEMALE DISABILITY
1.8/ 100
METRIC RATING
249th/ 347
METRIC RANK
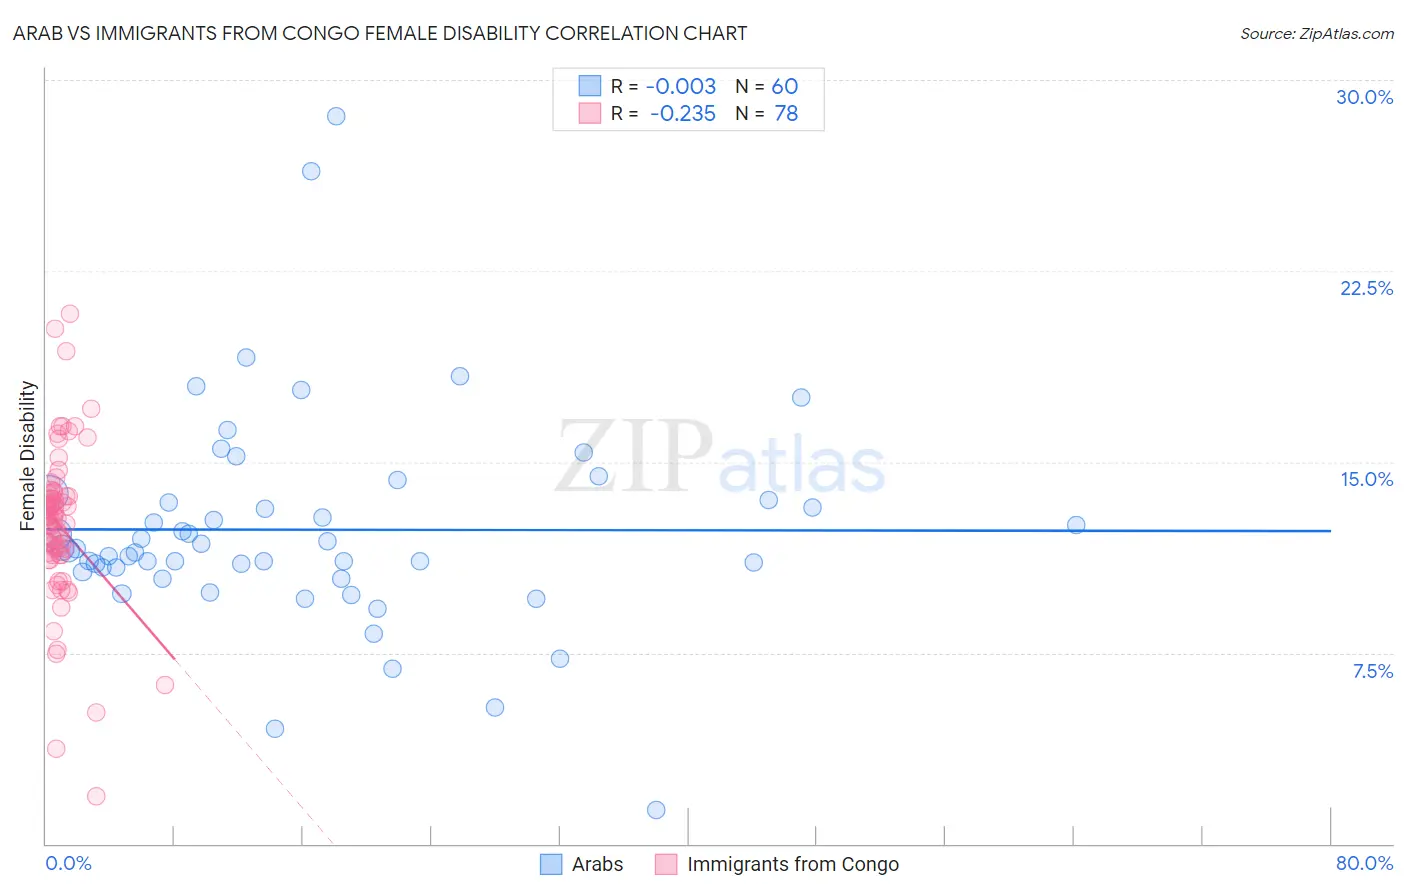
Arab vs Immigrants from Congo Female Disability Correlation Chart
The statistical analysis conducted on geographies consisting of 486,755,725 people shows no correlation between the proportion of Arabs and percentage of females with a disability in the United States with a correlation coefficient (R) of -0.003 and weighted average of 11.9%. Similarly, the statistical analysis conducted on geographies consisting of 92,114,824 people shows a weak negative correlation between the proportion of Immigrants from Congo and percentage of females with a disability in the United States with a correlation coefficient (R) of -0.235 and weighted average of 12.7%, a difference of 6.8%.
Female Disability Correlation Summary
| Measurement | Arab | Immigrants from Congo |
| Minimum | 1.3% | 1.9% |
| Maximum | 28.6% | 20.8% |
| Range | 27.3% | 19.0% |
| Mean | 12.3% | 12.5% |
| Median | 11.5% | 12.8% |
| Interquartile 25% (IQ1) | 10.8% | 11.4% |
| Interquartile 75% (IQ3) | 13.4% | 13.7% |
| Interquartile Range (IQR) | 2.7% | 2.3% |
| Standard Deviation (Sample) | 4.3% | 3.1% |
| Standard Deviation (Population) | 4.2% | 3.1% |
Similar Demographics by Female Disability
Demographics Similar to Arabs by Female Disability
In terms of female disability, the demographic groups most similar to Arabs are Nicaraguan (11.9%, a difference of 0.030%), Macedonian (11.8%, a difference of 0.090%), Immigrants from Syria (11.9%, a difference of 0.10%), Kenyan (11.9%, a difference of 0.11%), and Immigrants from Nicaragua (11.9%, a difference of 0.11%).
| Demographics | Rating | Rank | Female Disability |
| Russians | 96.5 /100 | #124 | Exceptional 11.8% |
| Immigrants | Italy | 96.4 /100 | #125 | Exceptional 11.8% |
| Immigrants | Europe | 96.2 /100 | #126 | Exceptional 11.8% |
| South American Indians | 95.8 /100 | #127 | Exceptional 11.8% |
| Immigrants | Latvia | 95.6 /100 | #128 | Exceptional 11.8% |
| Macedonians | 95.5 /100 | #129 | Exceptional 11.8% |
| Nicaraguans | 95.2 /100 | #130 | Exceptional 11.9% |
| Arabs | 95.1 /100 | #131 | Exceptional 11.9% |
| Immigrants | Syria | 94.6 /100 | #132 | Exceptional 11.9% |
| Kenyans | 94.5 /100 | #133 | Exceptional 11.9% |
| Immigrants | Nicaragua | 94.5 /100 | #134 | Exceptional 11.9% |
| Central Americans | 94.2 /100 | #135 | Exceptional 11.9% |
| Ugandans | 94.0 /100 | #136 | Exceptional 11.9% |
| Immigrants | Norway | 93.8 /100 | #137 | Exceptional 11.9% |
| Ecuadorians | 93.4 /100 | #138 | Exceptional 11.9% |
Demographics Similar to Immigrants from Congo by Female Disability
In terms of female disability, the demographic groups most similar to Immigrants from Congo are Slovene (12.7%, a difference of 0.040%), Crow (12.7%, a difference of 0.10%), Carpatho Rusyn (12.6%, a difference of 0.13%), Menominee (12.6%, a difference of 0.16%), and Spanish American Indian (12.6%, a difference of 0.18%).
| Demographics | Rating | Rank | Female Disability |
| Canadians | 2.6 /100 | #242 | Tragic 12.6% |
| Immigrants | Senegal | 2.5 /100 | #243 | Tragic 12.6% |
| Alsatians | 2.5 /100 | #244 | Tragic 12.6% |
| Immigrants | Jamaica | 2.2 /100 | #245 | Tragic 12.6% |
| Spanish American Indians | 2.1 /100 | #246 | Tragic 12.6% |
| Menominee | 2.1 /100 | #247 | Tragic 12.6% |
| Carpatho Rusyns | 2.0 /100 | #248 | Tragic 12.6% |
| Immigrants | Congo | 1.8 /100 | #249 | Tragic 12.7% |
| Slovenes | 1.7 /100 | #250 | Tragic 12.7% |
| Crow | 1.6 /100 | #251 | Tragic 12.7% |
| Immigrants | Caribbean | 1.4 /100 | #252 | Tragic 12.7% |
| Jamaicans | 1.4 /100 | #253 | Tragic 12.7% |
| Hawaiians | 1.4 /100 | #254 | Tragic 12.7% |
| Immigrants | Germany | 1.3 /100 | #255 | Tragic 12.7% |
| British West Indians | 1.2 /100 | #256 | Tragic 12.7% |