Immigrants from Sri Lanka vs Immigrants from Congo Female Disability
COMPARE
Immigrants from Sri Lanka
Immigrants from Congo
Female Disability
Female Disability Comparison
Immigrants from Sri Lanka
Immigrants from Congo
10.9%
FEMALE DISABILITY
100.0/ 100
METRIC RATING
22nd/ 347
METRIC RANK
12.7%
FEMALE DISABILITY
1.8/ 100
METRIC RATING
249th/ 347
METRIC RANK
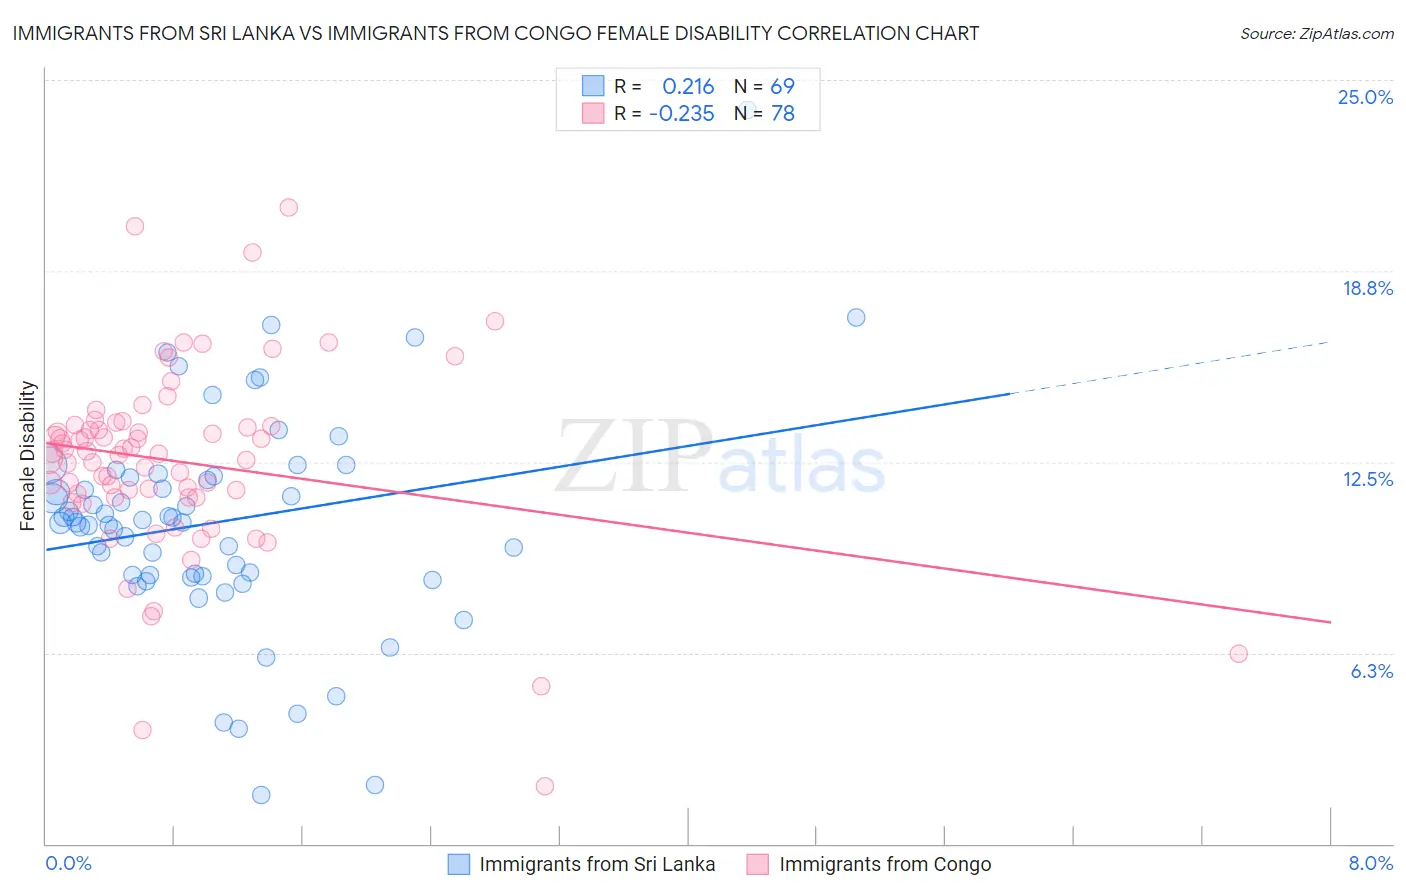
Immigrants from Sri Lanka vs Immigrants from Congo Female Disability Correlation Chart
The statistical analysis conducted on geographies consisting of 149,700,552 people shows a weak positive correlation between the proportion of Immigrants from Sri Lanka and percentage of females with a disability in the United States with a correlation coefficient (R) of 0.216 and weighted average of 10.9%. Similarly, the statistical analysis conducted on geographies consisting of 92,114,824 people shows a weak negative correlation between the proportion of Immigrants from Congo and percentage of females with a disability in the United States with a correlation coefficient (R) of -0.235 and weighted average of 12.7%, a difference of 15.8%.
Female Disability Correlation Summary
| Measurement | Immigrants from Sri Lanka | Immigrants from Congo |
| Minimum | 1.6% | 1.9% |
| Maximum | 24.0% | 20.8% |
| Range | 22.4% | 19.0% |
| Mean | 10.5% | 12.5% |
| Median | 10.5% | 12.8% |
| Interquartile 25% (IQ1) | 8.8% | 11.4% |
| Interquartile 75% (IQ3) | 12.0% | 13.7% |
| Interquartile Range (IQR) | 3.2% | 2.3% |
| Standard Deviation (Sample) | 3.6% | 3.1% |
| Standard Deviation (Population) | 3.6% | 3.1% |
Similar Demographics by Female Disability
Demographics Similar to Immigrants from Sri Lanka by Female Disability
In terms of female disability, the demographic groups most similar to Immigrants from Sri Lanka are Asian (10.9%, a difference of 0.13%), Venezuelan (11.0%, a difference of 0.22%), Immigrants from Pakistan (10.9%, a difference of 0.49%), Immigrants from Venezuela (10.9%, a difference of 0.66%), and Immigrants from Argentina (11.0%, a difference of 0.79%).
| Demographics | Rating | Rank | Female Disability |
| Burmese | 100.0 /100 | #15 | Exceptional 10.7% |
| Okinawans | 100.0 /100 | #16 | Exceptional 10.8% |
| Indians (Asian) | 100.0 /100 | #17 | Exceptional 10.8% |
| Immigrants | Iran | 100.0 /100 | #18 | Exceptional 10.8% |
| Immigrants | Venezuela | 100.0 /100 | #19 | Exceptional 10.9% |
| Immigrants | Pakistan | 100.0 /100 | #20 | Exceptional 10.9% |
| Asians | 100.0 /100 | #21 | Exceptional 10.9% |
| Immigrants | Sri Lanka | 100.0 /100 | #22 | Exceptional 10.9% |
| Venezuelans | 100.0 /100 | #23 | Exceptional 11.0% |
| Immigrants | Argentina | 100.0 /100 | #24 | Exceptional 11.0% |
| Immigrants | Asia | 100.0 /100 | #25 | Exceptional 11.0% |
| Argentineans | 100.0 /100 | #26 | Exceptional 11.0% |
| Immigrants | Turkey | 100.0 /100 | #27 | Exceptional 11.1% |
| Egyptians | 100.0 /100 | #28 | Exceptional 11.1% |
| Immigrants | Malaysia | 100.0 /100 | #29 | Exceptional 11.1% |
Demographics Similar to Immigrants from Congo by Female Disability
In terms of female disability, the demographic groups most similar to Immigrants from Congo are Slovene (12.7%, a difference of 0.040%), Crow (12.7%, a difference of 0.10%), Carpatho Rusyn (12.6%, a difference of 0.13%), Menominee (12.6%, a difference of 0.16%), and Spanish American Indian (12.6%, a difference of 0.18%).
| Demographics | Rating | Rank | Female Disability |
| Canadians | 2.6 /100 | #242 | Tragic 12.6% |
| Immigrants | Senegal | 2.5 /100 | #243 | Tragic 12.6% |
| Alsatians | 2.5 /100 | #244 | Tragic 12.6% |
| Immigrants | Jamaica | 2.2 /100 | #245 | Tragic 12.6% |
| Spanish American Indians | 2.1 /100 | #246 | Tragic 12.6% |
| Menominee | 2.1 /100 | #247 | Tragic 12.6% |
| Carpatho Rusyns | 2.0 /100 | #248 | Tragic 12.6% |
| Immigrants | Congo | 1.8 /100 | #249 | Tragic 12.7% |
| Slovenes | 1.7 /100 | #250 | Tragic 12.7% |
| Crow | 1.6 /100 | #251 | Tragic 12.7% |
| Immigrants | Caribbean | 1.4 /100 | #252 | Tragic 12.7% |
| Jamaicans | 1.4 /100 | #253 | Tragic 12.7% |
| Hawaiians | 1.4 /100 | #254 | Tragic 12.7% |
| Immigrants | Germany | 1.3 /100 | #255 | Tragic 12.7% |
| British West Indians | 1.2 /100 | #256 | Tragic 12.7% |