Arapaho vs Immigrants from Israel Vision Disability
COMPARE
Arapaho
Immigrants from Israel
Vision Disability
Vision Disability Comparison
Arapaho
Immigrants from Israel
2.6%
VISION DISABILITY
0.0/ 100
METRIC RATING
308th/ 347
METRIC RANK
1.8%
VISION DISABILITY
100.0/ 100
METRIC RATING
11th/ 347
METRIC RANK
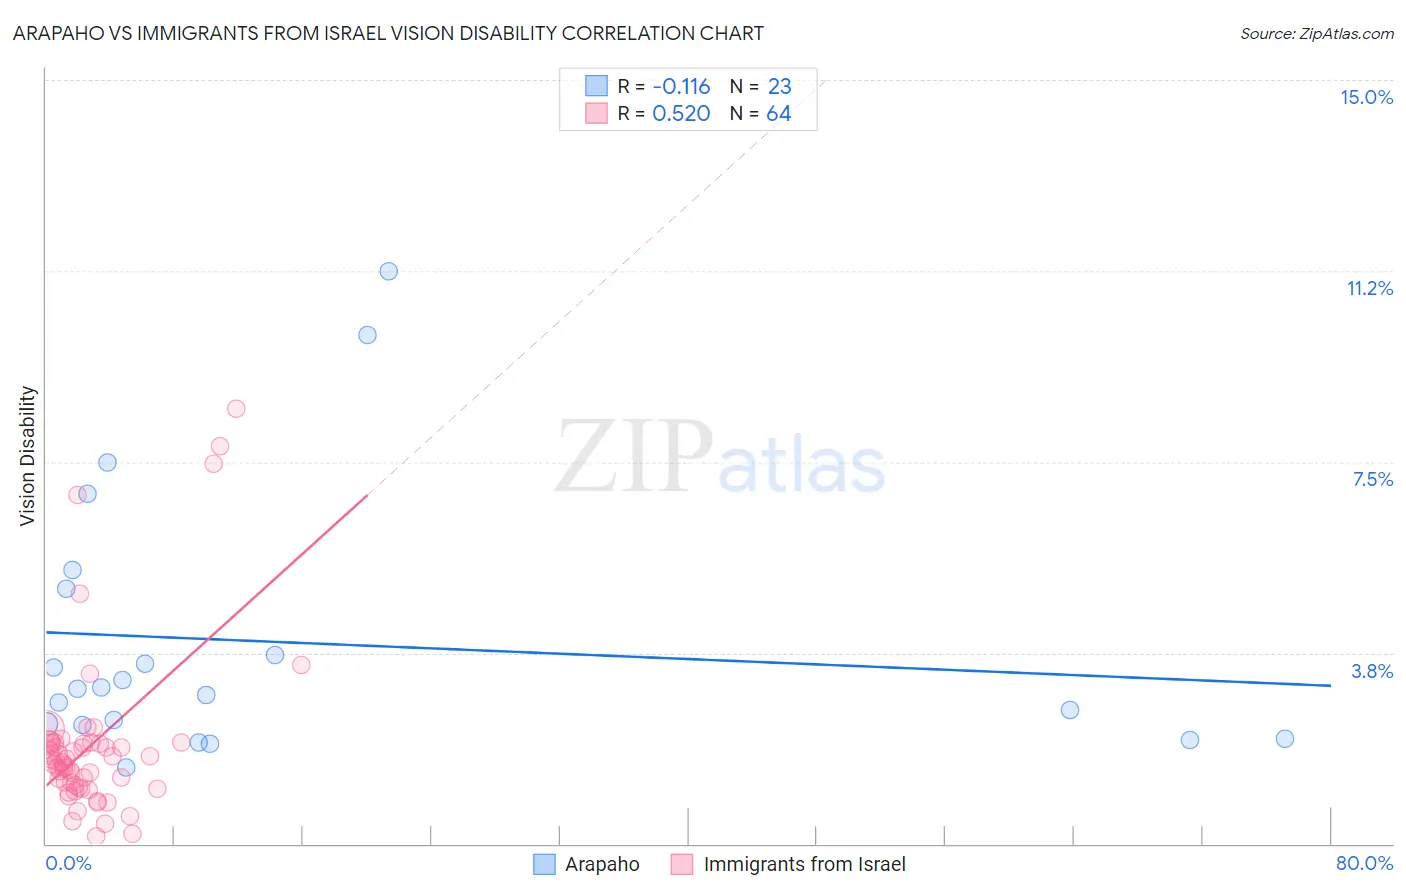
Arapaho vs Immigrants from Israel Vision Disability Correlation Chart
The statistical analysis conducted on geographies consisting of 29,770,133 people shows a poor negative correlation between the proportion of Arapaho and percentage of population with vision disability in the United States with a correlation coefficient (R) of -0.116 and weighted average of 2.6%. Similarly, the statistical analysis conducted on geographies consisting of 209,958,644 people shows a substantial positive correlation between the proportion of Immigrants from Israel and percentage of population with vision disability in the United States with a correlation coefficient (R) of 0.520 and weighted average of 1.8%, a difference of 42.9%.
Vision Disability Correlation Summary
| Measurement | Arapaho | Immigrants from Israel |
| Minimum | 1.5% | 0.15% |
| Maximum | 11.2% | 8.5% |
| Range | 9.7% | 8.4% |
| Mean | 4.0% | 1.9% |
| Median | 3.1% | 1.6% |
| Interquartile 25% (IQ1) | 2.3% | 1.1% |
| Interquartile 75% (IQ3) | 5.0% | 2.0% |
| Interquartile Range (IQR) | 2.7% | 0.84% |
| Standard Deviation (Sample) | 2.6% | 1.7% |
| Standard Deviation (Population) | 2.5% | 1.7% |
Similar Demographics by Vision Disability
Demographics Similar to Arapaho by Vision Disability
In terms of vision disability, the demographic groups most similar to Arapaho are Immigrants from Dominican Republic (2.6%, a difference of 0.020%), Iroquois (2.6%, a difference of 0.040%), Immigrants from Yemen (2.6%, a difference of 0.29%), Blackfeet (2.6%, a difference of 0.61%), and Hispanic or Latino (2.6%, a difference of 0.65%).
| Demographics | Rating | Rank | Vision Disability |
| Menominee | 0.0 /100 | #301 | Tragic 2.5% |
| Spanish American Indians | 0.0 /100 | #302 | Tragic 2.6% |
| Immigrants | Cabo Verde | 0.0 /100 | #303 | Tragic 2.6% |
| Aleuts | 0.0 /100 | #304 | Tragic 2.6% |
| Hispanics or Latinos | 0.0 /100 | #305 | Tragic 2.6% |
| Iroquois | 0.0 /100 | #306 | Tragic 2.6% |
| Immigrants | Dominican Republic | 0.0 /100 | #307 | Tragic 2.6% |
| Arapaho | 0.0 /100 | #308 | Tragic 2.6% |
| Immigrants | Yemen | 0.0 /100 | #309 | Tragic 2.6% |
| Blackfeet | 0.0 /100 | #310 | Tragic 2.6% |
| Dominicans | 0.0 /100 | #311 | Tragic 2.6% |
| Americans | 0.0 /100 | #312 | Tragic 2.6% |
| Potawatomi | 0.0 /100 | #313 | Tragic 2.6% |
| Inupiat | 0.0 /100 | #314 | Tragic 2.7% |
| Osage | 0.0 /100 | #315 | Tragic 2.7% |
Demographics Similar to Immigrants from Israel by Vision Disability
In terms of vision disability, the demographic groups most similar to Immigrants from Israel are Immigrants from Korea (1.8%, a difference of 0.23%), Immigrants from Eastern Asia (1.8%, a difference of 0.31%), Immigrants from China (1.8%, a difference of 0.45%), Immigrants from Bolivia (1.8%, a difference of 0.88%), and Immigrants from Hong Kong (1.8%, a difference of 1.1%).
| Demographics | Rating | Rank | Vision Disability |
| Thais | 100.0 /100 | #4 | Exceptional 1.7% |
| Okinawans | 100.0 /100 | #5 | Exceptional 1.8% |
| Immigrants | Iran | 100.0 /100 | #6 | Exceptional 1.8% |
| Immigrants | South Central Asia | 100.0 /100 | #7 | Exceptional 1.8% |
| Iranians | 100.0 /100 | #8 | Exceptional 1.8% |
| Immigrants | Singapore | 100.0 /100 | #9 | Exceptional 1.8% |
| Immigrants | Hong Kong | 100.0 /100 | #10 | Exceptional 1.8% |
| Immigrants | Israel | 100.0 /100 | #11 | Exceptional 1.8% |
| Immigrants | Korea | 100.0 /100 | #12 | Exceptional 1.8% |
| Immigrants | Eastern Asia | 100.0 /100 | #13 | Exceptional 1.8% |
| Immigrants | China | 100.0 /100 | #14 | Exceptional 1.8% |
| Immigrants | Bolivia | 100.0 /100 | #15 | Exceptional 1.8% |
| Indians (Asian) | 100.0 /100 | #16 | Exceptional 1.8% |
| Burmese | 100.0 /100 | #17 | Exceptional 1.8% |
| Bolivians | 100.0 /100 | #18 | Exceptional 1.9% |