Immigrants from Congo vs Immigrants from Israel Vision Disability
COMPARE
Immigrants from Congo
Immigrants from Israel
Vision Disability
Vision Disability Comparison
Immigrants from Congo
Immigrants from Israel
2.3%
VISION DISABILITY
1.4/ 100
METRIC RATING
236th/ 347
METRIC RANK
1.8%
VISION DISABILITY
100.0/ 100
METRIC RATING
11th/ 347
METRIC RANK
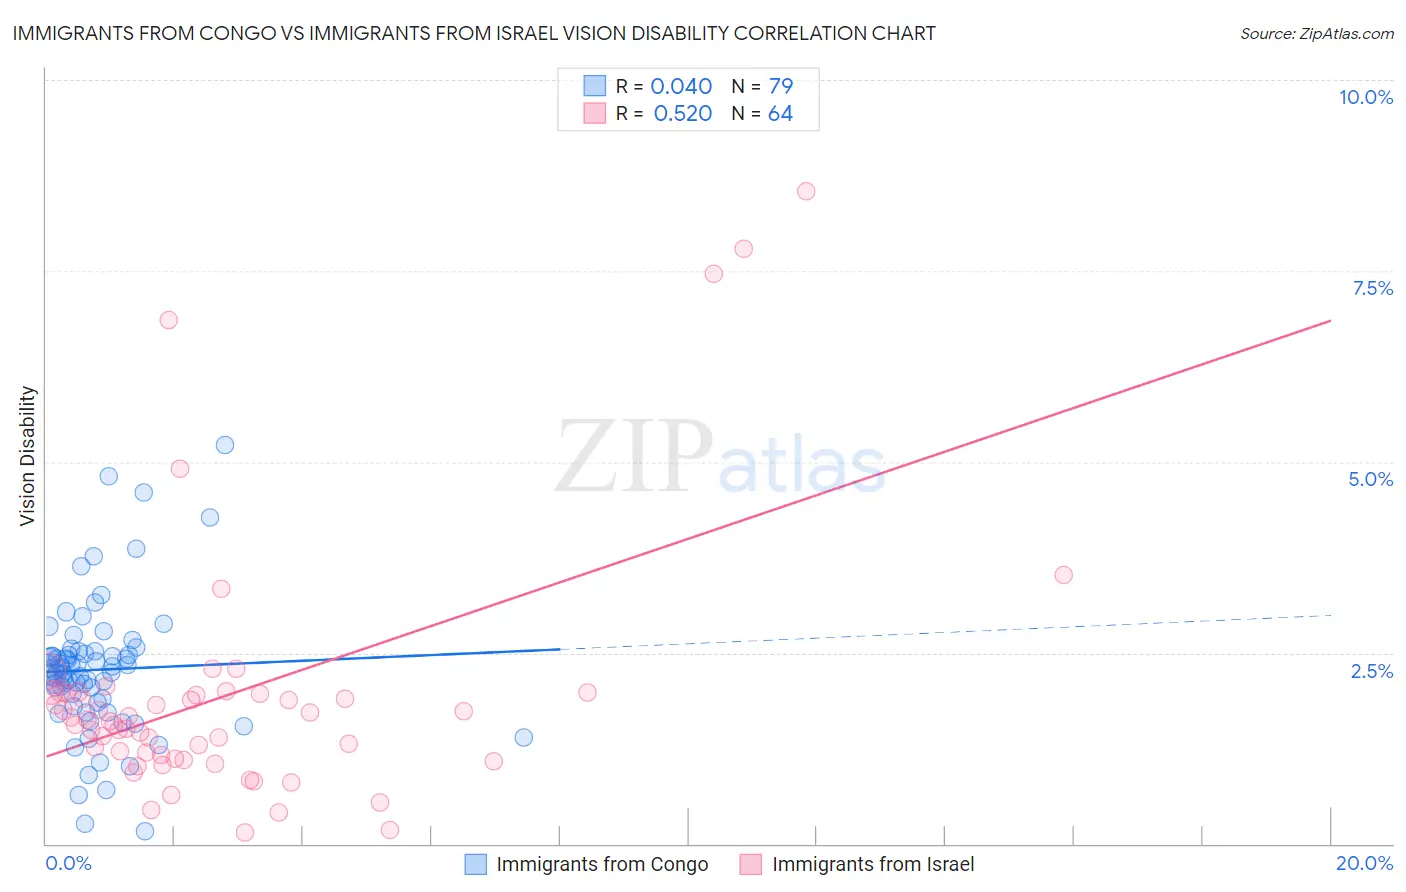
Immigrants from Congo vs Immigrants from Israel Vision Disability Correlation Chart
The statistical analysis conducted on geographies consisting of 92,098,538 people shows no correlation between the proportion of Immigrants from Congo and percentage of population with vision disability in the United States with a correlation coefficient (R) of 0.040 and weighted average of 2.3%. Similarly, the statistical analysis conducted on geographies consisting of 209,958,644 people shows a substantial positive correlation between the proportion of Immigrants from Israel and percentage of population with vision disability in the United States with a correlation coefficient (R) of 0.520 and weighted average of 1.8%, a difference of 26.6%.
Vision Disability Correlation Summary
| Measurement | Immigrants from Congo | Immigrants from Israel |
| Minimum | 0.17% | 0.15% |
| Maximum | 5.2% | 8.5% |
| Range | 5.1% | 8.4% |
| Mean | 2.3% | 1.9% |
| Median | 2.3% | 1.6% |
| Interquartile 25% (IQ1) | 1.8% | 1.1% |
| Interquartile 75% (IQ3) | 2.5% | 2.0% |
| Interquartile Range (IQR) | 0.67% | 0.84% |
| Standard Deviation (Sample) | 0.89% | 1.7% |
| Standard Deviation (Population) | 0.89% | 1.7% |
Similar Demographics by Vision Disability
Demographics Similar to Immigrants from Congo by Vision Disability
In terms of vision disability, the demographic groups most similar to Immigrants from Congo are Immigrants from Portugal (2.3%, a difference of 0.050%), Marshallese (2.3%, a difference of 0.090%), Scottish (2.3%, a difference of 0.16%), Immigrants from Cambodia (2.3%, a difference of 0.32%), and Central American (2.3%, a difference of 0.34%).
| Demographics | Rating | Rank | Vision Disability |
| Welsh | 2.3 /100 | #229 | Tragic 2.3% |
| Nicaraguans | 2.2 /100 | #230 | Tragic 2.3% |
| Immigrants | Ecuador | 2.0 /100 | #231 | Tragic 2.3% |
| German Russians | 1.8 /100 | #232 | Tragic 2.3% |
| Central Americans | 1.8 /100 | #233 | Tragic 2.3% |
| Scottish | 1.6 /100 | #234 | Tragic 2.3% |
| Marshallese | 1.5 /100 | #235 | Tragic 2.3% |
| Immigrants | Congo | 1.4 /100 | #236 | Tragic 2.3% |
| Immigrants | Portugal | 1.4 /100 | #237 | Tragic 2.3% |
| Immigrants | Cambodia | 1.1 /100 | #238 | Tragic 2.3% |
| English | 1.1 /100 | #239 | Tragic 2.3% |
| Panamanians | 0.9 /100 | #240 | Tragic 2.3% |
| Malaysians | 0.9 /100 | #241 | Tragic 2.3% |
| Immigrants | Panama | 0.8 /100 | #242 | Tragic 2.3% |
| Immigrants | Nicaragua | 0.6 /100 | #243 | Tragic 2.3% |
Demographics Similar to Immigrants from Israel by Vision Disability
In terms of vision disability, the demographic groups most similar to Immigrants from Israel are Immigrants from Korea (1.8%, a difference of 0.23%), Immigrants from Eastern Asia (1.8%, a difference of 0.31%), Immigrants from China (1.8%, a difference of 0.45%), Immigrants from Bolivia (1.8%, a difference of 0.88%), and Immigrants from Hong Kong (1.8%, a difference of 1.1%).
| Demographics | Rating | Rank | Vision Disability |
| Thais | 100.0 /100 | #4 | Exceptional 1.7% |
| Okinawans | 100.0 /100 | #5 | Exceptional 1.8% |
| Immigrants | Iran | 100.0 /100 | #6 | Exceptional 1.8% |
| Immigrants | South Central Asia | 100.0 /100 | #7 | Exceptional 1.8% |
| Iranians | 100.0 /100 | #8 | Exceptional 1.8% |
| Immigrants | Singapore | 100.0 /100 | #9 | Exceptional 1.8% |
| Immigrants | Hong Kong | 100.0 /100 | #10 | Exceptional 1.8% |
| Immigrants | Israel | 100.0 /100 | #11 | Exceptional 1.8% |
| Immigrants | Korea | 100.0 /100 | #12 | Exceptional 1.8% |
| Immigrants | Eastern Asia | 100.0 /100 | #13 | Exceptional 1.8% |
| Immigrants | China | 100.0 /100 | #14 | Exceptional 1.8% |
| Immigrants | Bolivia | 100.0 /100 | #15 | Exceptional 1.8% |
| Indians (Asian) | 100.0 /100 | #16 | Exceptional 1.8% |
| Burmese | 100.0 /100 | #17 | Exceptional 1.8% |
| Bolivians | 100.0 /100 | #18 | Exceptional 1.9% |