Immigrants from Iran vs Immigrants from Israel Vision Disability
COMPARE
Immigrants from Iran
Immigrants from Israel
Vision Disability
Vision Disability Comparison
Immigrants from Iran
Immigrants from Israel
1.8%
VISION DISABILITY
100.0/ 100
METRIC RATING
6th/ 347
METRIC RANK
1.8%
VISION DISABILITY
100.0/ 100
METRIC RATING
11th/ 347
METRIC RANK
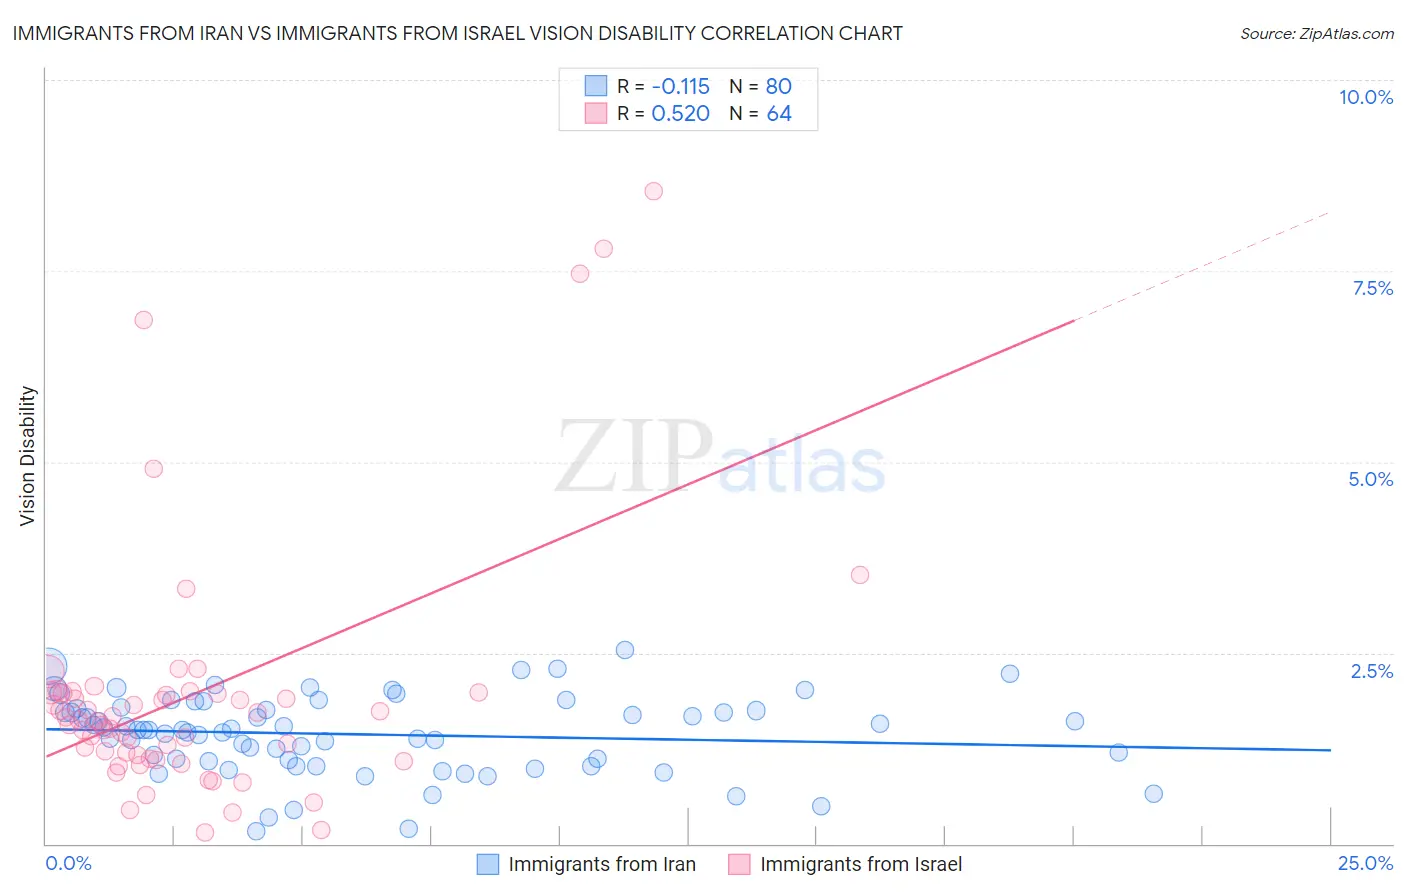
Immigrants from Iran vs Immigrants from Israel Vision Disability Correlation Chart
The statistical analysis conducted on geographies consisting of 279,802,933 people shows a poor negative correlation between the proportion of Immigrants from Iran and percentage of population with vision disability in the United States with a correlation coefficient (R) of -0.115 and weighted average of 1.8%. Similarly, the statistical analysis conducted on geographies consisting of 209,958,644 people shows a substantial positive correlation between the proportion of Immigrants from Israel and percentage of population with vision disability in the United States with a correlation coefficient (R) of 0.520 and weighted average of 1.8%, a difference of 2.3%.
Vision Disability Correlation Summary
| Measurement | Immigrants from Iran | Immigrants from Israel |
| Minimum | 0.16% | 0.15% |
| Maximum | 2.5% | 8.5% |
| Range | 2.4% | 8.4% |
| Mean | 1.4% | 1.9% |
| Median | 1.5% | 1.6% |
| Interquartile 25% (IQ1) | 1.1% | 1.1% |
| Interquartile 75% (IQ3) | 1.8% | 2.0% |
| Interquartile Range (IQR) | 0.67% | 0.84% |
| Standard Deviation (Sample) | 0.50% | 1.7% |
| Standard Deviation (Population) | 0.50% | 1.7% |
Demographics Similar to Immigrants from Iran and Immigrants from Israel by Vision Disability
In terms of vision disability, the demographic groups most similar to Immigrants from Iran are Immigrants from South Central Asia (1.8%, a difference of 0.060%), Iranian (1.8%, a difference of 0.21%), Okinawan (1.8%, a difference of 0.59%), Immigrants from Singapore (1.8%, a difference of 0.95%), and Immigrants from Hong Kong (1.8%, a difference of 1.1%). Similarly, the demographic groups most similar to Immigrants from Israel are Immigrants from Korea (1.8%, a difference of 0.23%), Immigrants from Eastern Asia (1.8%, a difference of 0.31%), Immigrants from China (1.8%, a difference of 0.45%), Immigrants from Bolivia (1.8%, a difference of 0.88%), and Immigrants from Hong Kong (1.8%, a difference of 1.1%).
| Demographics | Rating | Rank | Vision Disability |
| Immigrants | India | 100.0 /100 | #1 | Exceptional 1.7% |
| Filipinos | 100.0 /100 | #2 | Exceptional 1.7% |
| Immigrants | Taiwan | 100.0 /100 | #3 | Exceptional 1.7% |
| Thais | 100.0 /100 | #4 | Exceptional 1.7% |
| Okinawans | 100.0 /100 | #5 | Exceptional 1.8% |
| Immigrants | Iran | 100.0 /100 | #6 | Exceptional 1.8% |
| Immigrants | South Central Asia | 100.0 /100 | #7 | Exceptional 1.8% |
| Iranians | 100.0 /100 | #8 | Exceptional 1.8% |
| Immigrants | Singapore | 100.0 /100 | #9 | Exceptional 1.8% |
| Immigrants | Hong Kong | 100.0 /100 | #10 | Exceptional 1.8% |
| Immigrants | Israel | 100.0 /100 | #11 | Exceptional 1.8% |
| Immigrants | Korea | 100.0 /100 | #12 | Exceptional 1.8% |
| Immigrants | Eastern Asia | 100.0 /100 | #13 | Exceptional 1.8% |
| Immigrants | China | 100.0 /100 | #14 | Exceptional 1.8% |
| Immigrants | Bolivia | 100.0 /100 | #15 | Exceptional 1.8% |
| Indians (Asian) | 100.0 /100 | #16 | Exceptional 1.8% |
| Burmese | 100.0 /100 | #17 | Exceptional 1.8% |
| Bolivians | 100.0 /100 | #18 | Exceptional 1.9% |
| Immigrants | Sri Lanka | 100.0 /100 | #19 | Exceptional 1.9% |
| Asians | 100.0 /100 | #20 | Exceptional 1.9% |