Panamanian vs Immigrants from Israel Vision Disability
COMPARE
Panamanian
Immigrants from Israel
Vision Disability
Vision Disability Comparison
Panamanians
Immigrants from Israel
2.3%
VISION DISABILITY
0.9/ 100
METRIC RATING
240th/ 347
METRIC RANK
1.8%
VISION DISABILITY
100.0/ 100
METRIC RATING
11th/ 347
METRIC RANK
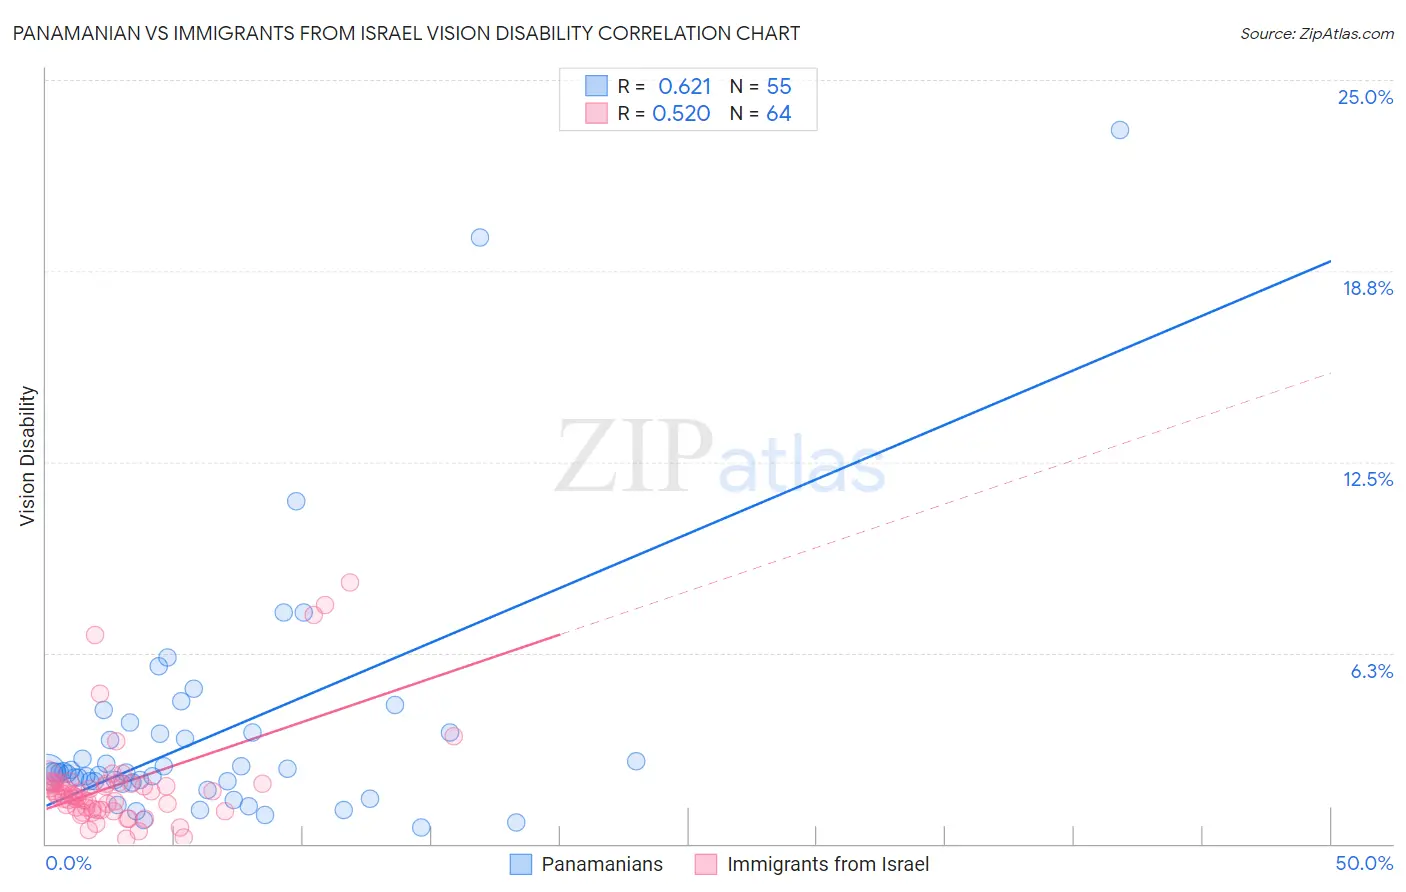
Panamanian vs Immigrants from Israel Vision Disability Correlation Chart
The statistical analysis conducted on geographies consisting of 281,084,996 people shows a significant positive correlation between the proportion of Panamanians and percentage of population with vision disability in the United States with a correlation coefficient (R) of 0.621 and weighted average of 2.3%. Similarly, the statistical analysis conducted on geographies consisting of 209,958,644 people shows a substantial positive correlation between the proportion of Immigrants from Israel and percentage of population with vision disability in the United States with a correlation coefficient (R) of 0.520 and weighted average of 1.8%, a difference of 27.4%.
Vision Disability Correlation Summary
| Measurement | Panamanian | Immigrants from Israel |
| Minimum | 0.54% | 0.15% |
| Maximum | 23.4% | 8.5% |
| Range | 22.8% | 8.4% |
| Mean | 3.5% | 1.9% |
| Median | 2.3% | 1.6% |
| Interquartile 25% (IQ1) | 2.0% | 1.1% |
| Interquartile 75% (IQ3) | 3.6% | 2.0% |
| Interquartile Range (IQR) | 1.6% | 0.84% |
| Standard Deviation (Sample) | 4.0% | 1.7% |
| Standard Deviation (Population) | 4.0% | 1.7% |
Similar Demographics by Vision Disability
Demographics Similar to Panamanians by Vision Disability
In terms of vision disability, the demographic groups most similar to Panamanians are Malaysian (2.3%, a difference of 0.030%), Immigrants from Panama (2.3%, a difference of 0.18%), English (2.3%, a difference of 0.25%), Immigrants from Cambodia (2.3%, a difference of 0.27%), and Immigrants from Portugal (2.3%, a difference of 0.54%).
| Demographics | Rating | Rank | Vision Disability |
| Central Americans | 1.8 /100 | #233 | Tragic 2.3% |
| Scottish | 1.6 /100 | #234 | Tragic 2.3% |
| Marshallese | 1.5 /100 | #235 | Tragic 2.3% |
| Immigrants | Congo | 1.4 /100 | #236 | Tragic 2.3% |
| Immigrants | Portugal | 1.4 /100 | #237 | Tragic 2.3% |
| Immigrants | Cambodia | 1.1 /100 | #238 | Tragic 2.3% |
| English | 1.1 /100 | #239 | Tragic 2.3% |
| Panamanians | 0.9 /100 | #240 | Tragic 2.3% |
| Malaysians | 0.9 /100 | #241 | Tragic 2.3% |
| Immigrants | Panama | 0.8 /100 | #242 | Tragic 2.3% |
| Immigrants | Nicaragua | 0.6 /100 | #243 | Tragic 2.3% |
| Immigrants | West Indies | 0.6 /100 | #244 | Tragic 2.3% |
| Alsatians | 0.6 /100 | #245 | Tragic 2.3% |
| French | 0.5 /100 | #246 | Tragic 2.3% |
| Guatemalans | 0.5 /100 | #247 | Tragic 2.3% |
Demographics Similar to Immigrants from Israel by Vision Disability
In terms of vision disability, the demographic groups most similar to Immigrants from Israel are Immigrants from Korea (1.8%, a difference of 0.23%), Immigrants from Eastern Asia (1.8%, a difference of 0.31%), Immigrants from China (1.8%, a difference of 0.45%), Immigrants from Bolivia (1.8%, a difference of 0.88%), and Immigrants from Hong Kong (1.8%, a difference of 1.1%).
| Demographics | Rating | Rank | Vision Disability |
| Thais | 100.0 /100 | #4 | Exceptional 1.7% |
| Okinawans | 100.0 /100 | #5 | Exceptional 1.8% |
| Immigrants | Iran | 100.0 /100 | #6 | Exceptional 1.8% |
| Immigrants | South Central Asia | 100.0 /100 | #7 | Exceptional 1.8% |
| Iranians | 100.0 /100 | #8 | Exceptional 1.8% |
| Immigrants | Singapore | 100.0 /100 | #9 | Exceptional 1.8% |
| Immigrants | Hong Kong | 100.0 /100 | #10 | Exceptional 1.8% |
| Immigrants | Israel | 100.0 /100 | #11 | Exceptional 1.8% |
| Immigrants | Korea | 100.0 /100 | #12 | Exceptional 1.8% |
| Immigrants | Eastern Asia | 100.0 /100 | #13 | Exceptional 1.8% |
| Immigrants | China | 100.0 /100 | #14 | Exceptional 1.8% |
| Immigrants | Bolivia | 100.0 /100 | #15 | Exceptional 1.8% |
| Indians (Asian) | 100.0 /100 | #16 | Exceptional 1.8% |
| Burmese | 100.0 /100 | #17 | Exceptional 1.8% |
| Bolivians | 100.0 /100 | #18 | Exceptional 1.9% |