Liberian vs Asian Disability
COMPARE
Liberian
Asian
Disability
Disability Comparison
Liberians
Asians
12.2%
DISABILITY
1.5/ 100
METRIC RATING
245th/ 347
METRIC RANK
10.4%
DISABILITY
100.0/ 100
METRIC RATING
21st/ 347
METRIC RANK
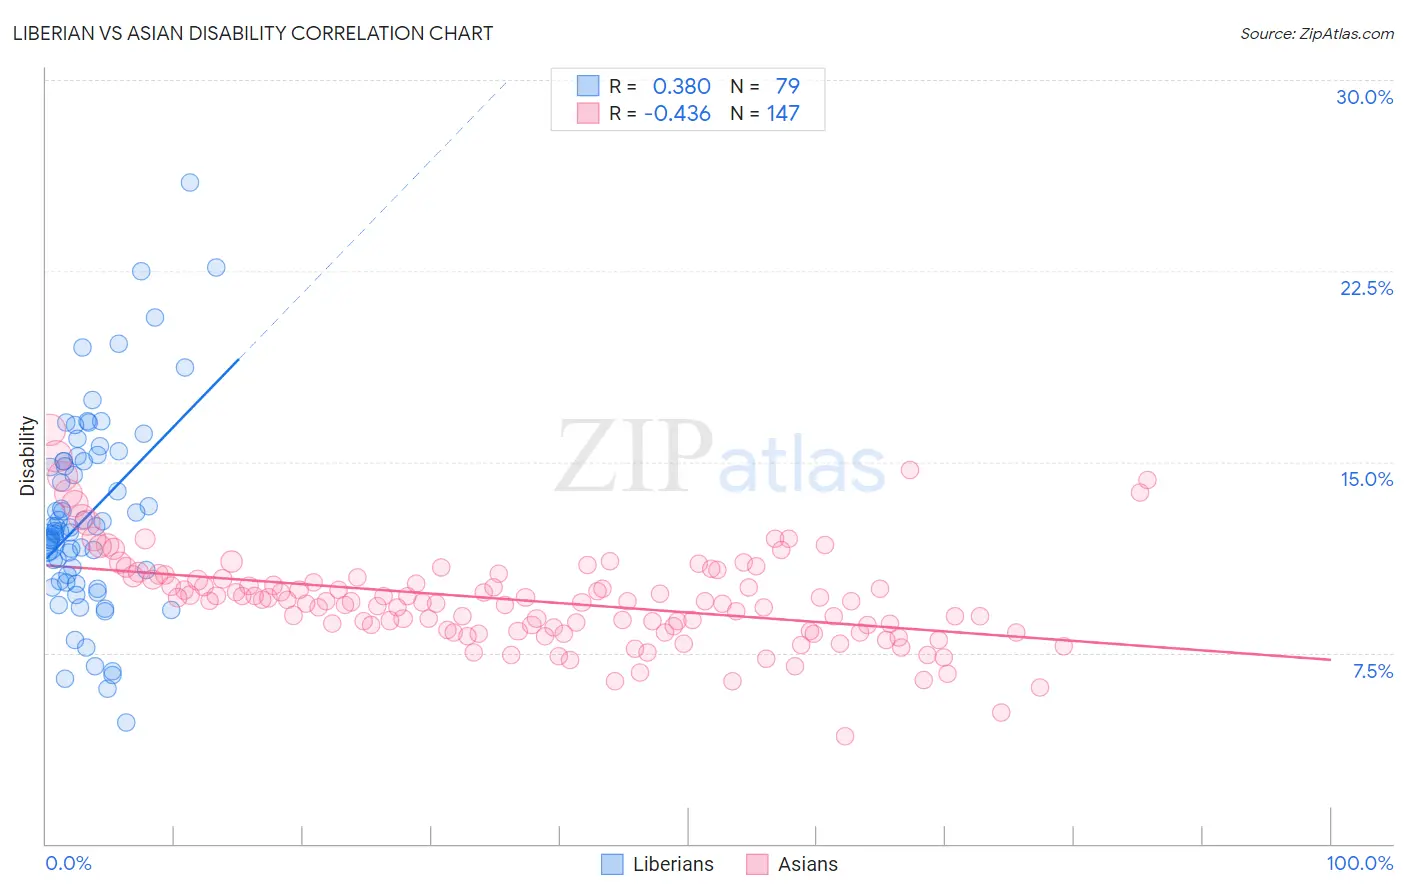
Liberian vs Asian Disability Correlation Chart
The statistical analysis conducted on geographies consisting of 118,083,063 people shows a mild positive correlation between the proportion of Liberians and percentage of population with a disability in the United States with a correlation coefficient (R) of 0.380 and weighted average of 12.2%. Similarly, the statistical analysis conducted on geographies consisting of 550,807,105 people shows a moderate negative correlation between the proportion of Asians and percentage of population with a disability in the United States with a correlation coefficient (R) of -0.436 and weighted average of 10.4%, a difference of 17.2%.
Disability Correlation Summary
| Measurement | Liberian | Asian |
| Minimum | 4.8% | 4.2% |
| Maximum | 26.0% | 16.3% |
| Range | 21.2% | 12.0% |
| Mean | 12.9% | 9.6% |
| Median | 12.3% | 9.5% |
| Interquartile 25% (IQ1) | 10.3% | 8.4% |
| Interquartile 75% (IQ3) | 15.0% | 10.4% |
| Interquartile Range (IQR) | 4.7% | 2.1% |
| Standard Deviation (Sample) | 3.9% | 1.9% |
| Standard Deviation (Population) | 3.9% | 1.9% |
Similar Demographics by Disability
Demographics Similar to Liberians by Disability
In terms of disability, the demographic groups most similar to Liberians are British (12.2%, a difference of 0.020%), Basque (12.2%, a difference of 0.020%), Swiss (12.2%, a difference of 0.030%), Indonesian (12.2%, a difference of 0.060%), and Polish (12.2%, a difference of 0.10%).
| Demographics | Rating | Rank | Disability |
| Norwegians | 1.9 /100 | #238 | Tragic 12.2% |
| Swedes | 1.8 /100 | #239 | Tragic 12.2% |
| Hungarians | 1.7 /100 | #240 | Tragic 12.2% |
| Yugoslavians | 1.7 /100 | #241 | Tragic 12.2% |
| Poles | 1.7 /100 | #242 | Tragic 12.2% |
| British | 1.5 /100 | #243 | Tragic 12.2% |
| Basques | 1.5 /100 | #244 | Tragic 12.2% |
| Liberians | 1.5 /100 | #245 | Tragic 12.2% |
| Swiss | 1.5 /100 | #246 | Tragic 12.2% |
| Indonesians | 1.4 /100 | #247 | Tragic 12.2% |
| Guamanians/Chamorros | 1.4 /100 | #248 | Tragic 12.3% |
| Carpatho Rusyns | 1.4 /100 | #249 | Tragic 12.3% |
| Sub-Saharan Africans | 1.4 /100 | #250 | Tragic 12.3% |
| Europeans | 1.4 /100 | #251 | Tragic 12.3% |
| Bermudans | 1.1 /100 | #252 | Tragic 12.3% |
Demographics Similar to Asians by Disability
In terms of disability, the demographic groups most similar to Asians are Immigrants from Venezuela (10.4%, a difference of 0.030%), Immigrants from Sri Lanka (10.5%, a difference of 0.10%), Burmese (10.4%, a difference of 0.72%), Immigrants from Pakistan (10.4%, a difference of 0.72%), and Immigrants from Asia (10.5%, a difference of 0.80%).
| Demographics | Rating | Rank | Disability |
| Immigrants | Korea | 100.0 /100 | #14 | Exceptional 10.2% |
| Okinawans | 100.0 /100 | #15 | Exceptional 10.3% |
| Indians (Asian) | 100.0 /100 | #16 | Exceptional 10.3% |
| Immigrants | Iran | 100.0 /100 | #17 | Exceptional 10.3% |
| Burmese | 100.0 /100 | #18 | Exceptional 10.4% |
| Immigrants | Pakistan | 100.0 /100 | #19 | Exceptional 10.4% |
| Immigrants | Venezuela | 100.0 /100 | #20 | Exceptional 10.4% |
| Asians | 100.0 /100 | #21 | Exceptional 10.4% |
| Immigrants | Sri Lanka | 100.0 /100 | #22 | Exceptional 10.5% |
| Immigrants | Asia | 100.0 /100 | #23 | Exceptional 10.5% |
| Venezuelans | 100.0 /100 | #24 | Exceptional 10.5% |
| Immigrants | Malaysia | 100.0 /100 | #25 | Exceptional 10.6% |
| Argentineans | 100.0 /100 | #26 | Exceptional 10.6% |
| Cypriots | 100.0 /100 | #27 | Exceptional 10.6% |
| Egyptians | 100.0 /100 | #28 | Exceptional 10.6% |