Latvian vs Chinese Disability Age 5 to 17
COMPARE
Latvian
Chinese
Disability Age 5 to 17
Disability Age 5 to 17 Comparison
Latvians
Chinese
5.4%
DISABILITY AGE 5 TO 17
95.0/ 100
METRIC RATING
127th/ 347
METRIC RANK
4.7%
DISABILITY AGE 5 TO 17
100.0/ 100
METRIC RATING
15th/ 347
METRIC RANK
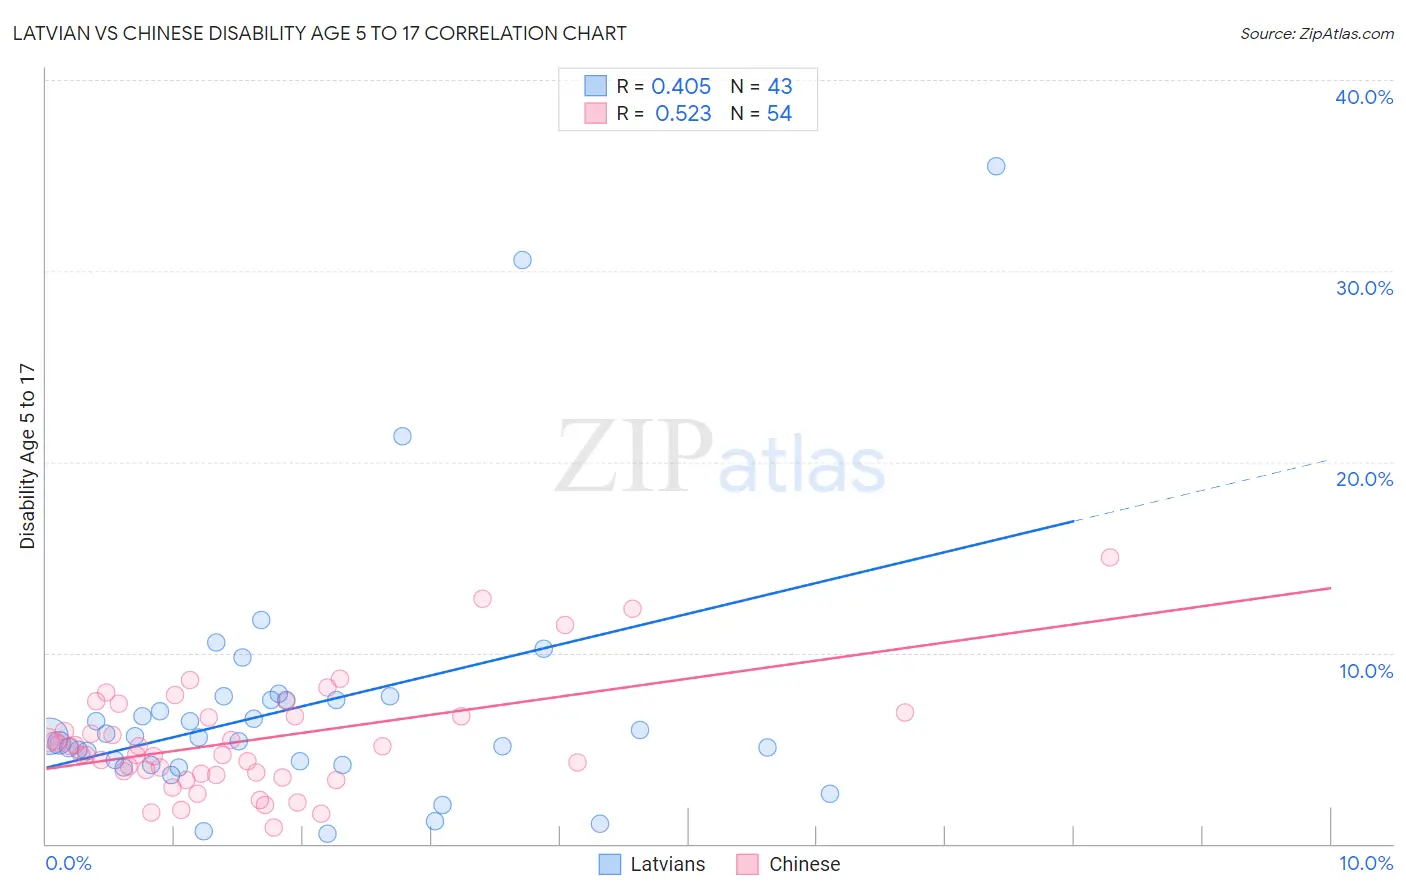
Latvian vs Chinese Disability Age 5 to 17 Correlation Chart
The statistical analysis conducted on geographies consisting of 219,260,682 people shows a moderate positive correlation between the proportion of Latvians and percentage of population with a disability between the ages 5 and 17 in the United States with a correlation coefficient (R) of 0.405 and weighted average of 5.4%. Similarly, the statistical analysis conducted on geographies consisting of 64,726,058 people shows a substantial positive correlation between the proportion of Chinese and percentage of population with a disability between the ages 5 and 17 in the United States with a correlation coefficient (R) of 0.523 and weighted average of 4.7%, a difference of 14.9%.
Disability Age 5 to 17 Correlation Summary
| Measurement | Latvian | Chinese |
| Minimum | 0.51% | 0.88% |
| Maximum | 35.5% | 15.0% |
| Range | 35.0% | 14.1% |
| Mean | 7.2% | 5.4% |
| Median | 5.6% | 4.9% |
| Interquartile 25% (IQ1) | 4.1% | 3.7% |
| Interquartile 75% (IQ3) | 7.5% | 6.7% |
| Interquartile Range (IQR) | 3.4% | 3.0% |
| Standard Deviation (Sample) | 6.8% | 2.9% |
| Standard Deviation (Population) | 6.7% | 2.8% |
Similar Demographics by Disability Age 5 to 17
Demographics Similar to Latvians by Disability Age 5 to 17
In terms of disability age 5 to 17, the demographic groups most similar to Latvians are New Zealander (5.4%, a difference of 0.0%), Immigrants from Chile (5.4%, a difference of 0.010%), Crow (5.4%, a difference of 0.030%), Immigrants from Venezuela (5.4%, a difference of 0.11%), and Immigrants from Ethiopia (5.4%, a difference of 0.16%).
| Demographics | Rating | Rank | Disability Age 5 to 17 |
| Immigrants | Immigrants | 97.0 /100 | #120 | Exceptional 5.4% |
| Maltese | 96.0 /100 | #121 | Exceptional 5.4% |
| Chileans | 95.8 /100 | #122 | Exceptional 5.4% |
| Immigrants | Ethiopia | 95.5 /100 | #123 | Exceptional 5.4% |
| Crow | 95.0 /100 | #124 | Exceptional 5.4% |
| Immigrants | Chile | 95.0 /100 | #125 | Exceptional 5.4% |
| New Zealanders | 95.0 /100 | #126 | Exceptional 5.4% |
| Latvians | 95.0 /100 | #127 | Exceptional 5.4% |
| Immigrants | Venezuela | 94.5 /100 | #128 | Exceptional 5.4% |
| Romanians | 94.1 /100 | #129 | Exceptional 5.4% |
| Immigrants | Bulgaria | 94.0 /100 | #130 | Exceptional 5.4% |
| Arabs | 92.9 /100 | #131 | Exceptional 5.4% |
| Immigrants | Colombia | 92.9 /100 | #132 | Exceptional 5.4% |
| Venezuelans | 92.7 /100 | #133 | Exceptional 5.4% |
| Yuman | 92.3 /100 | #134 | Exceptional 5.4% |
Demographics Similar to Chinese by Disability Age 5 to 17
In terms of disability age 5 to 17, the demographic groups most similar to Chinese are Immigrants from Korea (4.7%, a difference of 0.20%), Immigrants from Singapore (4.7%, a difference of 0.42%), Arapaho (4.7%, a difference of 0.88%), Immigrants from South Central Asia (4.7%, a difference of 0.90%), and Thai (4.7%, a difference of 0.91%).
| Demographics | Rating | Rank | Disability Age 5 to 17 |
| Indians (Asian) | 100.0 /100 | #8 | Exceptional 4.6% |
| Immigrants | Eastern Asia | 100.0 /100 | #9 | Exceptional 4.6% |
| Immigrants | India | 100.0 /100 | #10 | Exceptional 4.6% |
| Armenians | 100.0 /100 | #11 | Exceptional 4.6% |
| Iranians | 100.0 /100 | #12 | Exceptional 4.6% |
| Thais | 100.0 /100 | #13 | Exceptional 4.7% |
| Immigrants | Korea | 100.0 /100 | #14 | Exceptional 4.7% |
| Chinese | 100.0 /100 | #15 | Exceptional 4.7% |
| Immigrants | Singapore | 100.0 /100 | #16 | Exceptional 4.7% |
| Arapaho | 100.0 /100 | #17 | Exceptional 4.7% |
| Immigrants | South Central Asia | 100.0 /100 | #18 | Exceptional 4.7% |
| Immigrants | Uzbekistan | 100.0 /100 | #19 | Exceptional 4.8% |
| Burmese | 100.0 /100 | #20 | Exceptional 4.8% |
| Yup'ik | 100.0 /100 | #21 | Exceptional 4.8% |
| Asians | 100.0 /100 | #22 | Exceptional 4.8% |