Immigrants from Cameroon vs Marshallese Ambulatory Disability
COMPARE
Immigrants from Cameroon
Marshallese
Ambulatory Disability
Ambulatory Disability Comparison
Immigrants from Cameroon
Marshallese
5.7%
AMBULATORY DISABILITY
99.4/ 100
METRIC RATING
74th/ 347
METRIC RANK
6.9%
AMBULATORY DISABILITY
0.0/ 100
METRIC RATING
300th/ 347
METRIC RANK
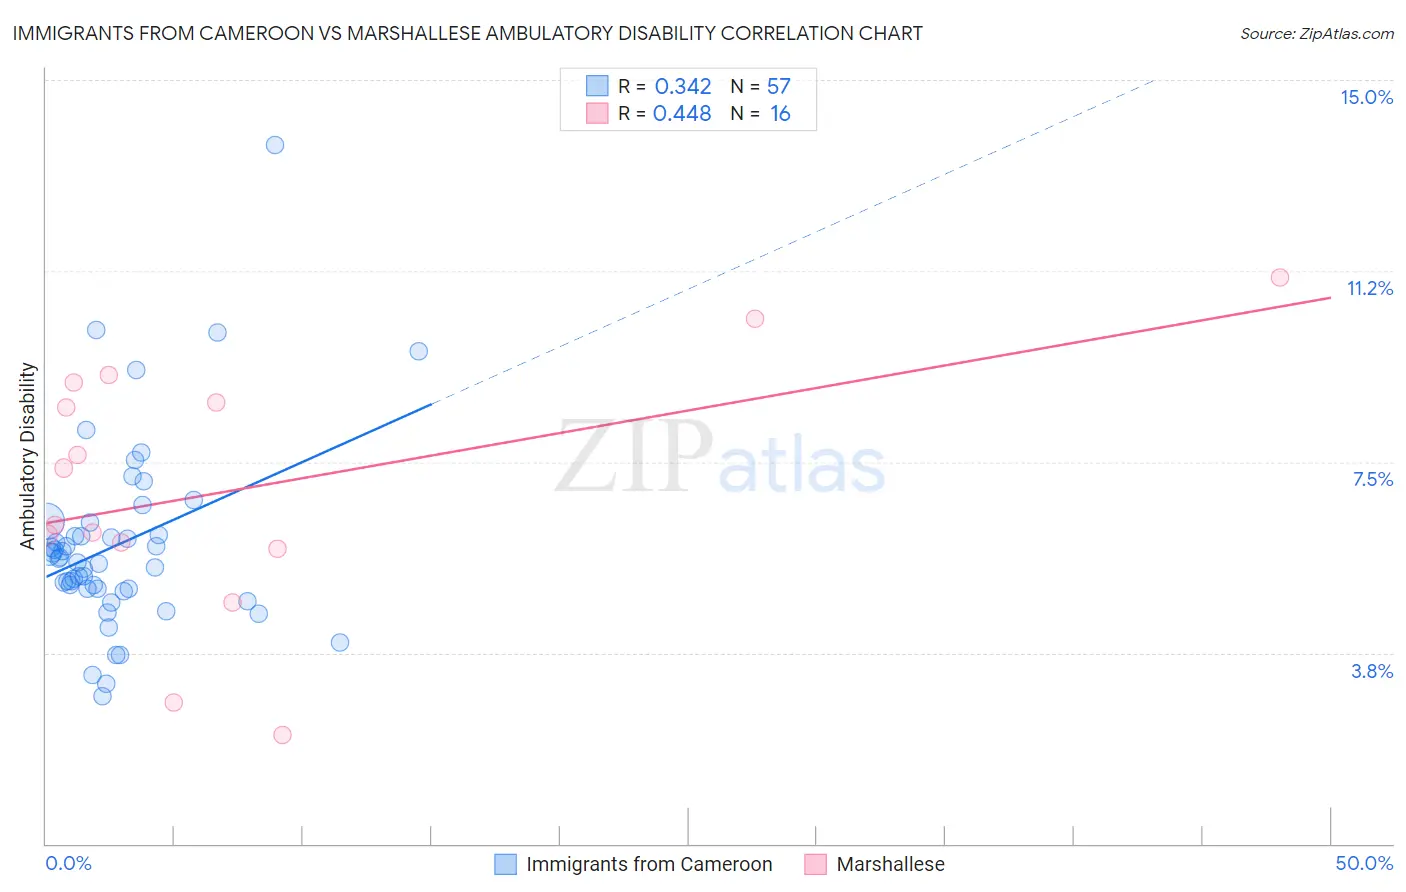
Immigrants from Cameroon vs Marshallese Ambulatory Disability Correlation Chart
The statistical analysis conducted on geographies consisting of 130,739,199 people shows a mild positive correlation between the proportion of Immigrants from Cameroon and percentage of population with ambulatory disability in the United States with a correlation coefficient (R) of 0.342 and weighted average of 5.7%. Similarly, the statistical analysis conducted on geographies consisting of 14,761,315 people shows a moderate positive correlation between the proportion of Marshallese and percentage of population with ambulatory disability in the United States with a correlation coefficient (R) of 0.448 and weighted average of 6.9%, a difference of 21.7%.
Ambulatory Disability Correlation Summary
| Measurement | Immigrants from Cameroon | Marshallese |
| Minimum | 2.9% | 2.1% |
| Maximum | 13.7% | 11.1% |
| Range | 10.8% | 9.0% |
| Mean | 5.9% | 7.0% |
| Median | 5.6% | 6.8% |
| Interquartile 25% (IQ1) | 5.0% | 5.8% |
| Interquartile 75% (IQ3) | 6.2% | 8.9% |
| Interquartile Range (IQR) | 1.2% | 3.0% |
| Standard Deviation (Sample) | 1.9% | 2.5% |
| Standard Deviation (Population) | 1.8% | 2.4% |
Similar Demographics by Ambulatory Disability
Demographics Similar to Immigrants from Cameroon by Ambulatory Disability
In terms of ambulatory disability, the demographic groups most similar to Immigrants from Cameroon are Immigrants from Northern Africa (5.7%, a difference of 0.010%), Brazilian (5.7%, a difference of 0.020%), Immigrants from Peru (5.7%, a difference of 0.040%), Immigrants from South Africa (5.7%, a difference of 0.050%), and Sudanese (5.7%, a difference of 0.070%).
| Demographics | Rating | Rank | Ambulatory Disability |
| Immigrants | Uganda | 99.6 /100 | #67 | Exceptional 5.7% |
| Sri Lankans | 99.6 /100 | #68 | Exceptional 5.7% |
| Peruvians | 99.5 /100 | #69 | Exceptional 5.7% |
| Sierra Leoneans | 99.4 /100 | #70 | Exceptional 5.7% |
| Immigrants | Peru | 99.4 /100 | #71 | Exceptional 5.7% |
| Brazilians | 99.4 /100 | #72 | Exceptional 5.7% |
| Immigrants | Northern Africa | 99.4 /100 | #73 | Exceptional 5.7% |
| Immigrants | Cameroon | 99.4 /100 | #74 | Exceptional 5.7% |
| Immigrants | South Africa | 99.3 /100 | #75 | Exceptional 5.7% |
| Sudanese | 99.3 /100 | #76 | Exceptional 5.7% |
| Immigrants | Vietnam | 99.3 /100 | #77 | Exceptional 5.7% |
| Somalis | 99.2 /100 | #78 | Exceptional 5.7% |
| Chileans | 99.2 /100 | #79 | Exceptional 5.7% |
| Immigrants | Ireland | 99.2 /100 | #80 | Exceptional 5.7% |
| Immigrants | Jordan | 99.2 /100 | #81 | Exceptional 5.7% |
Demographics Similar to Marshallese by Ambulatory Disability
In terms of ambulatory disability, the demographic groups most similar to Marshallese are Puget Sound Salish (6.9%, a difference of 0.010%), Immigrants from Grenada (6.9%, a difference of 0.14%), French American Indian (6.9%, a difference of 0.15%), British West Indian (7.0%, a difference of 0.23%), and Immigrants from Armenia (7.0%, a difference of 0.28%).
| Demographics | Rating | Rank | Ambulatory Disability |
| Immigrants | St. Vincent and the Grenadines | 0.0 /100 | #293 | Tragic 6.9% |
| Cape Verdeans | 0.0 /100 | #294 | Tragic 6.9% |
| Crow | 0.0 /100 | #295 | Tragic 6.9% |
| Alaskan Athabascans | 0.0 /100 | #296 | Tragic 6.9% |
| French American Indians | 0.0 /100 | #297 | Tragic 6.9% |
| Immigrants | Grenada | 0.0 /100 | #298 | Tragic 6.9% |
| Puget Sound Salish | 0.0 /100 | #299 | Tragic 6.9% |
| Marshallese | 0.0 /100 | #300 | Tragic 6.9% |
| British West Indians | 0.0 /100 | #301 | Tragic 7.0% |
| Immigrants | Armenia | 0.0 /100 | #302 | Tragic 7.0% |
| Africans | 0.0 /100 | #303 | Tragic 7.0% |
| Immigrants | Cabo Verde | 0.0 /100 | #304 | Tragic 7.0% |
| Immigrants | Micronesia | 0.0 /100 | #305 | Tragic 7.0% |
| Iroquois | 0.0 /100 | #306 | Tragic 7.1% |
| Spanish Americans | 0.0 /100 | #307 | Tragic 7.1% |