Korean vs Immigrants from Austria Disability
COMPARE
Korean
Immigrants from Austria
Disability
Disability Comparison
Koreans
Immigrants from Austria
11.3%
DISABILITY
93.8/ 100
METRIC RATING
118th/ 347
METRIC RANK
11.7%
DISABILITY
53.4/ 100
METRIC RATING
169th/ 347
METRIC RANK
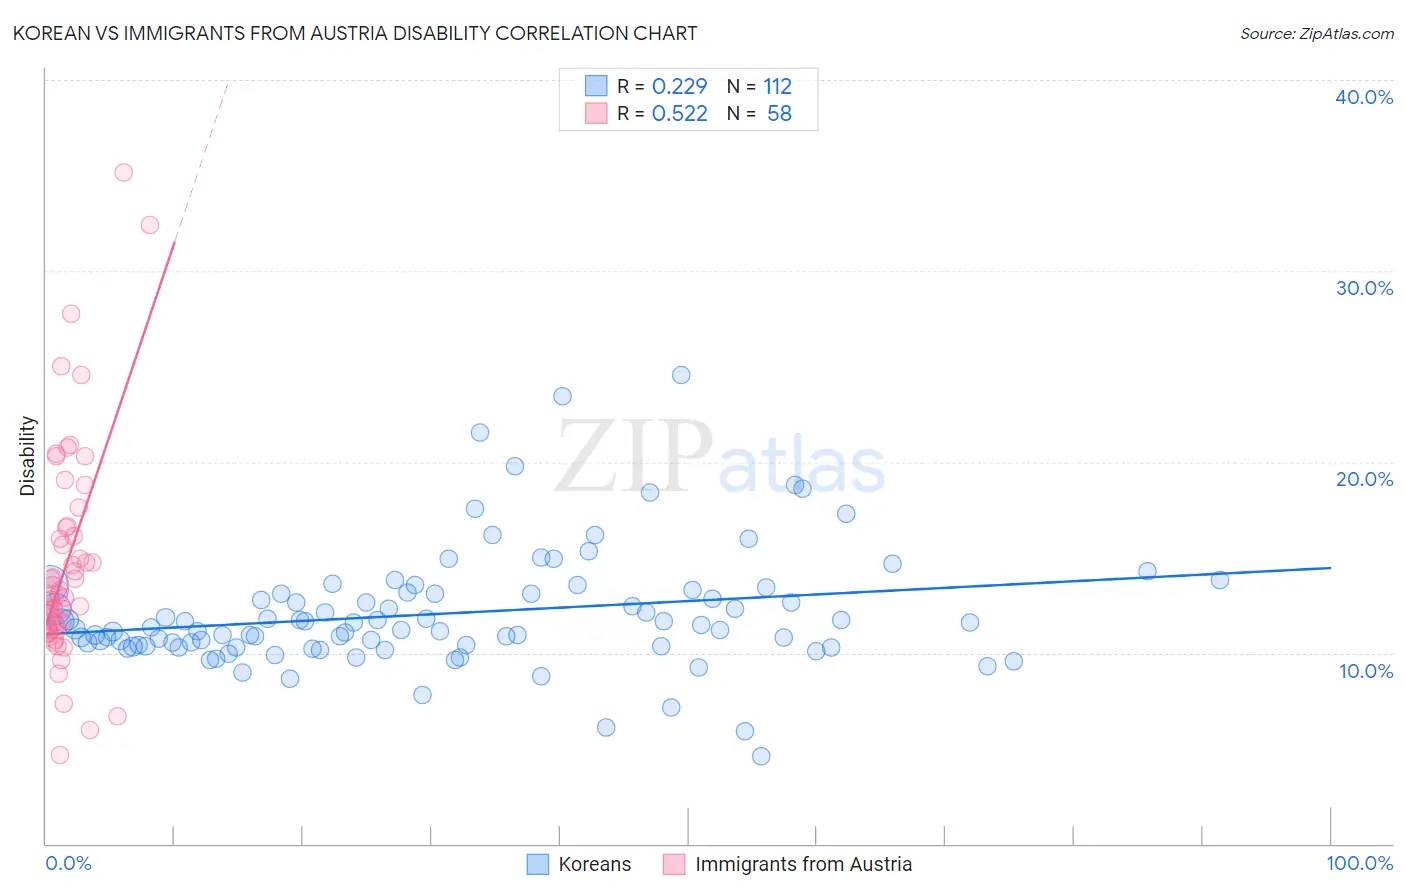
Korean vs Immigrants from Austria Disability Correlation Chart
The statistical analysis conducted on geographies consisting of 510,851,171 people shows a weak positive correlation between the proportion of Koreans and percentage of population with a disability in the United States with a correlation coefficient (R) of 0.229 and weighted average of 11.3%. Similarly, the statistical analysis conducted on geographies consisting of 167,973,413 people shows a substantial positive correlation between the proportion of Immigrants from Austria and percentage of population with a disability in the United States with a correlation coefficient (R) of 0.522 and weighted average of 11.7%, a difference of 2.9%.
Disability Correlation Summary
| Measurement | Korean | Immigrants from Austria |
| Minimum | 4.6% | 4.6% |
| Maximum | 24.5% | 35.2% |
| Range | 20.0% | 30.5% |
| Mean | 12.1% | 14.6% |
| Median | 11.3% | 13.0% |
| Interquartile 25% (IQ1) | 10.3% | 11.2% |
| Interquartile 75% (IQ3) | 13.1% | 16.5% |
| Interquartile Range (IQR) | 2.8% | 5.3% |
| Standard Deviation (Sample) | 3.1% | 5.8% |
| Standard Deviation (Population) | 3.1% | 5.8% |
Similar Demographics by Disability
Demographics Similar to Koreans by Disability
In terms of disability, the demographic groups most similar to Koreans are Luxembourger (11.3%, a difference of 0.010%), Central American (11.4%, a difference of 0.050%), Immigrants from North Macedonia (11.4%, a difference of 0.060%), Immigrants from Northern Europe (11.3%, a difference of 0.070%), and Immigrants from Costa Rica (11.4%, a difference of 0.070%).
| Demographics | Rating | Rank | Disability |
| Immigrants | South Eastern Asia | 95.4 /100 | #111 | Exceptional 11.3% |
| Immigrants | Uzbekistan | 94.9 /100 | #112 | Exceptional 11.3% |
| Guyanese | 94.7 /100 | #113 | Exceptional 11.3% |
| Immigrants | Syria | 94.7 /100 | #114 | Exceptional 11.3% |
| Immigrants | Philippines | 94.6 /100 | #115 | Exceptional 11.3% |
| Immigrants | Northern Europe | 94.1 /100 | #116 | Exceptional 11.3% |
| Luxembourgers | 93.9 /100 | #117 | Exceptional 11.3% |
| Koreans | 93.8 /100 | #118 | Exceptional 11.3% |
| Central Americans | 93.5 /100 | #119 | Exceptional 11.4% |
| Immigrants | North Macedonia | 93.5 /100 | #120 | Exceptional 11.4% |
| Immigrants | Costa Rica | 93.4 /100 | #121 | Exceptional 11.4% |
| Brazilians | 93.3 /100 | #122 | Exceptional 11.4% |
| South Africans | 92.3 /100 | #123 | Exceptional 11.4% |
| South American Indians | 92.2 /100 | #124 | Exceptional 11.4% |
| Costa Ricans | 91.9 /100 | #125 | Exceptional 11.4% |
Demographics Similar to Immigrants from Austria by Disability
In terms of disability, the demographic groups most similar to Immigrants from Austria are Immigrants from Latin America (11.7%, a difference of 0.030%), Immigrants from Albania (11.7%, a difference of 0.030%), Immigrants from Southern Europe (11.7%, a difference of 0.030%), Trinidadian and Tobagonian (11.7%, a difference of 0.030%), and Estonian (11.7%, a difference of 0.050%).
| Demographics | Rating | Rank | Disability |
| Immigrants | Haiti | 59.2 /100 | #162 | Average 11.7% |
| Immigrants | Trinidad and Tobago | 58.9 /100 | #163 | Average 11.7% |
| Syrians | 58.5 /100 | #164 | Average 11.7% |
| Cubans | 56.7 /100 | #165 | Average 11.7% |
| Pakistanis | 54.7 /100 | #166 | Average 11.7% |
| Estonians | 54.4 /100 | #167 | Average 11.7% |
| Immigrants | Latin America | 54.1 /100 | #168 | Average 11.7% |
| Immigrants | Austria | 53.4 /100 | #169 | Average 11.7% |
| Immigrants | Albania | 52.8 /100 | #170 | Average 11.7% |
| Immigrants | Southern Europe | 52.8 /100 | #171 | Average 11.7% |
| Trinidadians and Tobagonians | 52.7 /100 | #172 | Average 11.7% |
| Maltese | 50.6 /100 | #173 | Average 11.7% |
| Albanians | 50.0 /100 | #174 | Average 11.7% |
| Haitians | 48.6 /100 | #175 | Average 11.7% |
| Immigrants | Western Africa | 47.5 /100 | #176 | Average 11.7% |