Korean vs Laotian Female Disability
COMPARE
Korean
Laotian
Female Disability
Female Disability Comparison
Koreans
Laotians
11.7%
FEMALE DISABILITY
99.0/ 100
METRIC RATING
97th/ 347
METRIC RANK
11.4%
FEMALE DISABILITY
99.9/ 100
METRIC RATING
58th/ 347
METRIC RANK
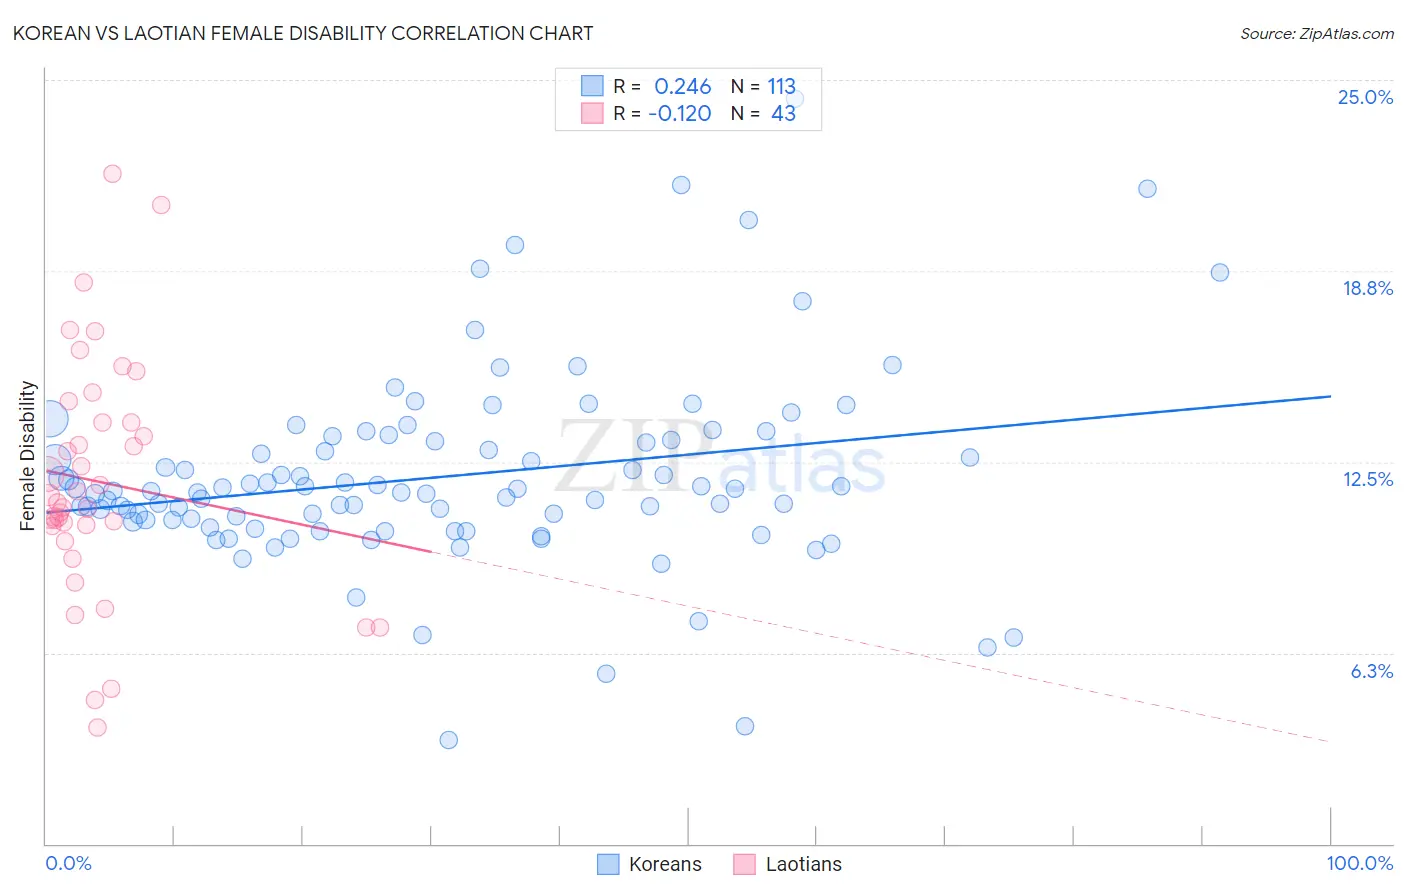
Korean vs Laotian Female Disability Correlation Chart
The statistical analysis conducted on geographies consisting of 510,799,967 people shows a weak positive correlation between the proportion of Koreans and percentage of females with a disability in the United States with a correlation coefficient (R) of 0.246 and weighted average of 11.7%. Similarly, the statistical analysis conducted on geographies consisting of 224,852,766 people shows a poor negative correlation between the proportion of Laotians and percentage of females with a disability in the United States with a correlation coefficient (R) of -0.120 and weighted average of 11.4%, a difference of 2.6%.
Female Disability Correlation Summary
| Measurement | Korean | Laotian |
| Minimum | 3.4% | 3.8% |
| Maximum | 24.4% | 21.9% |
| Range | 21.0% | 18.1% |
| Mean | 12.0% | 11.8% |
| Median | 11.5% | 11.2% |
| Interquartile 25% (IQ1) | 10.6% | 10.4% |
| Interquartile 75% (IQ3) | 13.2% | 13.8% |
| Interquartile Range (IQR) | 2.6% | 3.4% |
| Standard Deviation (Sample) | 3.2% | 3.9% |
| Standard Deviation (Population) | 3.2% | 3.8% |
Similar Demographics by Female Disability
Demographics Similar to Koreans by Female Disability
In terms of female disability, the demographic groups most similar to Koreans are Immigrants from Russia (11.7%, a difference of 0.0%), Uruguayan (11.7%, a difference of 0.14%), Immigrants from Philippines (11.7%, a difference of 0.35%), Immigrants from Uruguay (11.7%, a difference of 0.40%), and Immigrants from Costa Rica (11.7%, a difference of 0.42%).
| Demographics | Rating | Rank | Female Disability |
| Immigrants | Romania | 99.5 /100 | #90 | Exceptional 11.6% |
| Immigrants | Zimbabwe | 99.5 /100 | #91 | Exceptional 11.6% |
| Immigrants | Czechoslovakia | 99.5 /100 | #92 | Exceptional 11.6% |
| Immigrants | Sierra Leone | 99.4 /100 | #93 | Exceptional 11.6% |
| Immigrants | Brazil | 99.4 /100 | #94 | Exceptional 11.6% |
| Immigrants | Northern Europe | 99.4 /100 | #95 | Exceptional 11.6% |
| Immigrants | Russia | 99.0 /100 | #96 | Exceptional 11.7% |
| Koreans | 99.0 /100 | #97 | Exceptional 11.7% |
| Uruguayans | 98.8 /100 | #98 | Exceptional 11.7% |
| Immigrants | Philippines | 98.6 /100 | #99 | Exceptional 11.7% |
| Immigrants | Uruguay | 98.5 /100 | #100 | Exceptional 11.7% |
| Immigrants | Costa Rica | 98.4 /100 | #101 | Exceptional 11.7% |
| Immigrants | South Eastern Asia | 98.4 /100 | #102 | Exceptional 11.7% |
| Immigrants | Eastern Africa | 98.3 /100 | #103 | Exceptional 11.7% |
| Immigrants | Western Asia | 98.3 /100 | #104 | Exceptional 11.7% |
Demographics Similar to Laotians by Female Disability
In terms of female disability, the demographic groups most similar to Laotians are South American (11.4%, a difference of 0.020%), Taiwanese (11.4%, a difference of 0.090%), Immigrants from Spain (11.4%, a difference of 0.13%), Immigrants from Bulgaria (11.4%, a difference of 0.25%), and Immigrants from France (11.4%, a difference of 0.31%).
| Demographics | Rating | Rank | Female Disability |
| Immigrants | Belgium | 100.0 /100 | #51 | Exceptional 11.3% |
| Immigrants | Peru | 99.9 /100 | #52 | Exceptional 11.3% |
| Immigrants | Saudi Arabia | 99.9 /100 | #53 | Exceptional 11.3% |
| Peruvians | 99.9 /100 | #54 | Exceptional 11.3% |
| Bulgarians | 99.9 /100 | #55 | Exceptional 11.3% |
| Taiwanese | 99.9 /100 | #56 | Exceptional 11.4% |
| South Americans | 99.9 /100 | #57 | Exceptional 11.4% |
| Laotians | 99.9 /100 | #58 | Exceptional 11.4% |
| Immigrants | Spain | 99.9 /100 | #59 | Exceptional 11.4% |
| Immigrants | Bulgaria | 99.9 /100 | #60 | Exceptional 11.4% |
| Immigrants | France | 99.9 /100 | #61 | Exceptional 11.4% |
| Sri Lankans | 99.9 /100 | #62 | Exceptional 11.4% |
| Immigrants | Colombia | 99.9 /100 | #63 | Exceptional 11.4% |
| Immigrants | El Salvador | 99.9 /100 | #64 | Exceptional 11.4% |
| Immigrants | South America | 99.9 /100 | #65 | Exceptional 11.4% |