Korean vs Czech Female Disability
COMPARE
Korean
Czech
Female Disability
Female Disability Comparison
Koreans
Czechs
11.7%
FEMALE DISABILITY
99.0/ 100
METRIC RATING
97th/ 347
METRIC RANK
12.1%
FEMALE DISABILITY
63.6/ 100
METRIC RATING
164th/ 347
METRIC RANK
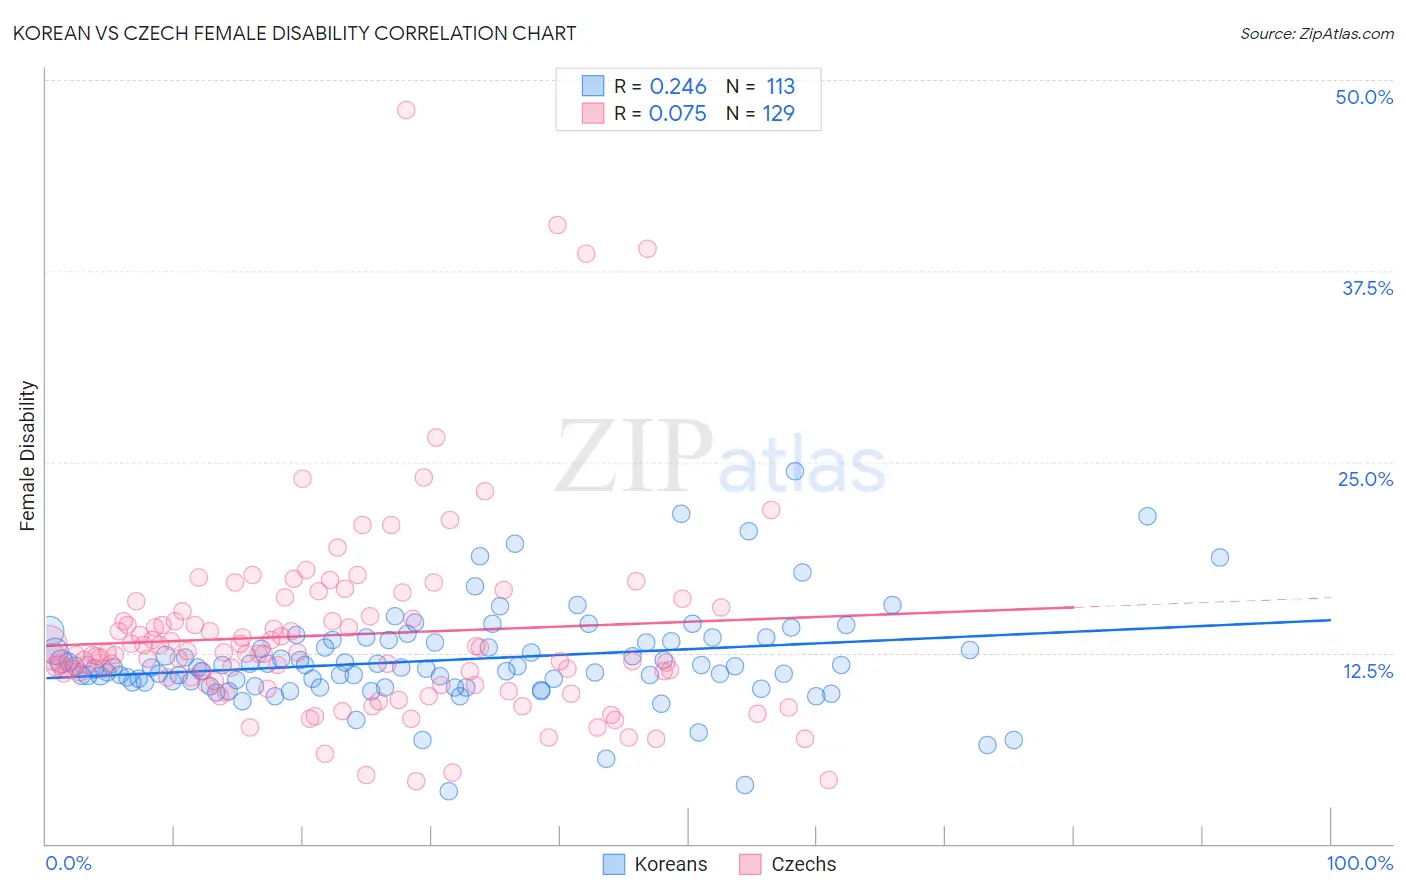
Korean vs Czech Female Disability Correlation Chart
The statistical analysis conducted on geographies consisting of 510,799,967 people shows a weak positive correlation between the proportion of Koreans and percentage of females with a disability in the United States with a correlation coefficient (R) of 0.246 and weighted average of 11.7%. Similarly, the statistical analysis conducted on geographies consisting of 484,697,758 people shows a slight positive correlation between the proportion of Czechs and percentage of females with a disability in the United States with a correlation coefficient (R) of 0.075 and weighted average of 12.1%, a difference of 4.0%.
Female Disability Correlation Summary
| Measurement | Korean | Czech |
| Minimum | 3.4% | 4.1% |
| Maximum | 24.4% | 48.0% |
| Range | 21.0% | 43.9% |
| Mean | 12.0% | 13.7% |
| Median | 11.5% | 12.5% |
| Interquartile 25% (IQ1) | 10.6% | 10.6% |
| Interquartile 75% (IQ3) | 13.2% | 14.8% |
| Interquartile Range (IQR) | 2.6% | 4.3% |
| Standard Deviation (Sample) | 3.2% | 6.4% |
| Standard Deviation (Population) | 3.2% | 6.4% |
Similar Demographics by Female Disability
Demographics Similar to Koreans by Female Disability
In terms of female disability, the demographic groups most similar to Koreans are Immigrants from Russia (11.7%, a difference of 0.0%), Uruguayan (11.7%, a difference of 0.14%), Immigrants from Philippines (11.7%, a difference of 0.35%), Immigrants from Uruguay (11.7%, a difference of 0.40%), and Immigrants from Costa Rica (11.7%, a difference of 0.42%).
| Demographics | Rating | Rank | Female Disability |
| Immigrants | Romania | 99.5 /100 | #90 | Exceptional 11.6% |
| Immigrants | Zimbabwe | 99.5 /100 | #91 | Exceptional 11.6% |
| Immigrants | Czechoslovakia | 99.5 /100 | #92 | Exceptional 11.6% |
| Immigrants | Sierra Leone | 99.4 /100 | #93 | Exceptional 11.6% |
| Immigrants | Brazil | 99.4 /100 | #94 | Exceptional 11.6% |
| Immigrants | Northern Europe | 99.4 /100 | #95 | Exceptional 11.6% |
| Immigrants | Russia | 99.0 /100 | #96 | Exceptional 11.7% |
| Koreans | 99.0 /100 | #97 | Exceptional 11.7% |
| Uruguayans | 98.8 /100 | #98 | Exceptional 11.7% |
| Immigrants | Philippines | 98.6 /100 | #99 | Exceptional 11.7% |
| Immigrants | Uruguay | 98.5 /100 | #100 | Exceptional 11.7% |
| Immigrants | Costa Rica | 98.4 /100 | #101 | Exceptional 11.7% |
| Immigrants | South Eastern Asia | 98.4 /100 | #102 | Exceptional 11.7% |
| Immigrants | Eastern Africa | 98.3 /100 | #103 | Exceptional 11.7% |
| Immigrants | Western Asia | 98.3 /100 | #104 | Exceptional 11.7% |
Demographics Similar to Czechs by Female Disability
In terms of female disability, the demographic groups most similar to Czechs are Guatemalan (12.1%, a difference of 0.010%), Immigrants from Ukraine (12.1%, a difference of 0.030%), Guyanese (12.1%, a difference of 0.040%), Immigrants from Oceania (12.1%, a difference of 0.070%), and Immigrants from Guatemala (12.1%, a difference of 0.10%).
| Demographics | Rating | Rank | Female Disability |
| Danes | 72.5 /100 | #157 | Good 12.1% |
| Immigrants | Middle Africa | 72.4 /100 | #158 | Good 12.1% |
| Immigrants | Central America | 67.7 /100 | #159 | Good 12.1% |
| Immigrants | Guatemala | 66.0 /100 | #160 | Good 12.1% |
| Guyanese | 64.7 /100 | #161 | Good 12.1% |
| Immigrants | Ukraine | 64.3 /100 | #162 | Good 12.1% |
| Guatemalans | 63.8 /100 | #163 | Good 12.1% |
| Czechs | 63.6 /100 | #164 | Good 12.1% |
| Immigrants | Oceania | 61.8 /100 | #165 | Good 12.1% |
| Lithuanians | 59.5 /100 | #166 | Average 12.2% |
| Immigrants | Latin America | 59.0 /100 | #167 | Average 12.2% |
| Immigrants | Haiti | 58.8 /100 | #168 | Average 12.2% |
| Lebanese | 58.1 /100 | #169 | Average 12.2% |
| Maltese | 57.0 /100 | #170 | Average 12.2% |
| Immigrants | Southern Europe | 56.3 /100 | #171 | Average 12.2% |