Korean vs Aleut Female Disability
COMPARE
Korean
Aleut
Female Disability
Female Disability Comparison
Koreans
Aleuts
11.7%
FEMALE DISABILITY
99.0/ 100
METRIC RATING
97th/ 347
METRIC RANK
12.7%
FEMALE DISABILITY
1.1/ 100
METRIC RATING
258th/ 347
METRIC RANK
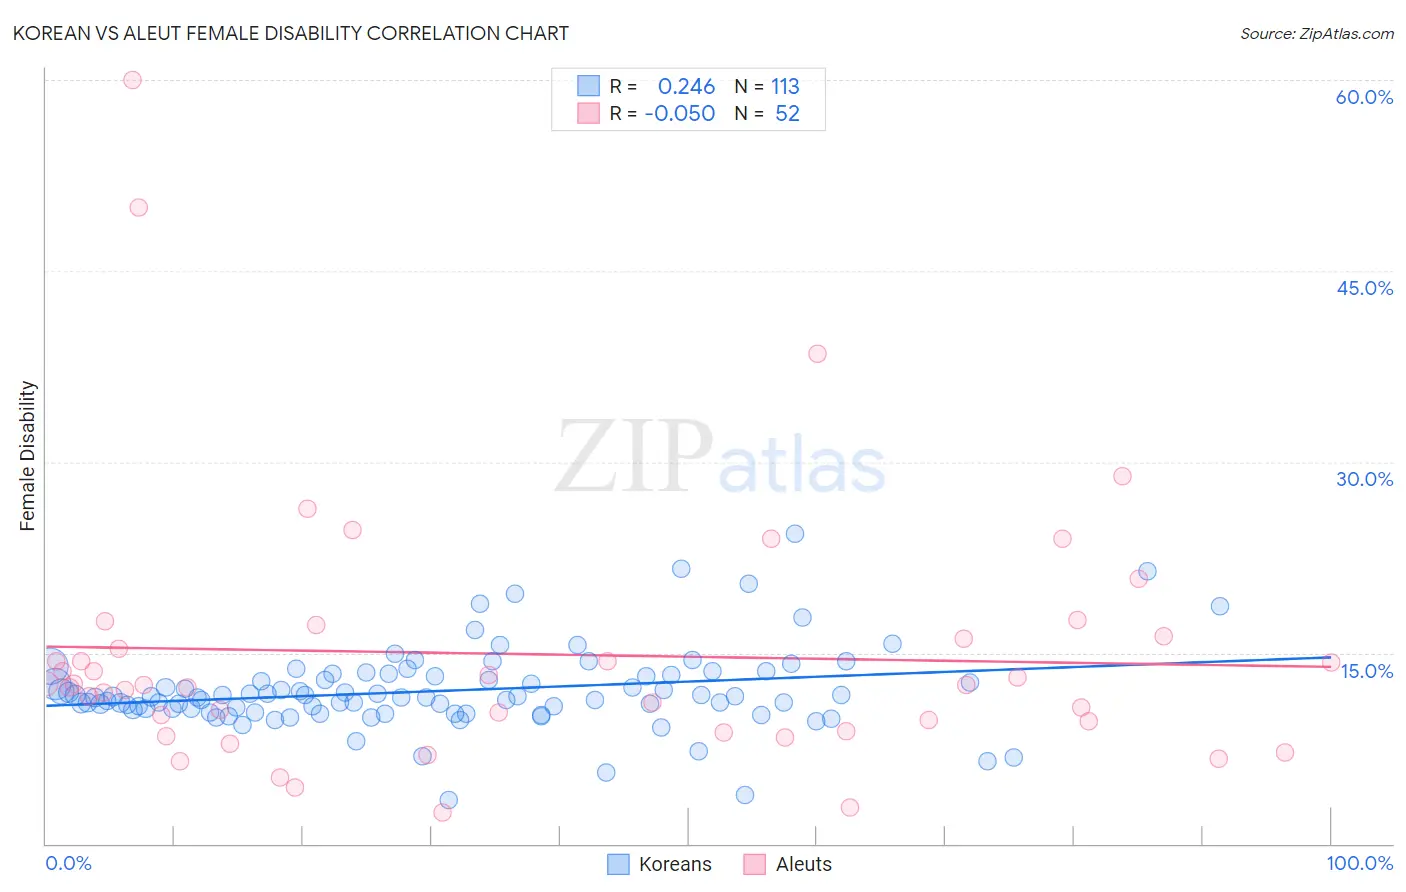
Korean vs Aleut Female Disability Correlation Chart
The statistical analysis conducted on geographies consisting of 510,799,967 people shows a weak positive correlation between the proportion of Koreans and percentage of females with a disability in the United States with a correlation coefficient (R) of 0.246 and weighted average of 11.7%. Similarly, the statistical analysis conducted on geographies consisting of 61,781,040 people shows no correlation between the proportion of Aleuts and percentage of females with a disability in the United States with a correlation coefficient (R) of -0.050 and weighted average of 12.7%, a difference of 8.9%.
Female Disability Correlation Summary
| Measurement | Korean | Aleut |
| Minimum | 3.4% | 2.5% |
| Maximum | 24.4% | 60.0% |
| Range | 21.0% | 57.5% |
| Mean | 12.0% | 14.9% |
| Median | 11.5% | 12.5% |
| Interquartile 25% (IQ1) | 10.6% | 9.2% |
| Interquartile 75% (IQ3) | 13.2% | 16.2% |
| Interquartile Range (IQR) | 2.6% | 7.0% |
| Standard Deviation (Sample) | 3.2% | 10.5% |
| Standard Deviation (Population) | 3.2% | 10.4% |
Similar Demographics by Female Disability
Demographics Similar to Koreans by Female Disability
In terms of female disability, the demographic groups most similar to Koreans are Immigrants from Russia (11.7%, a difference of 0.0%), Uruguayan (11.7%, a difference of 0.14%), Immigrants from Philippines (11.7%, a difference of 0.35%), Immigrants from Uruguay (11.7%, a difference of 0.40%), and Immigrants from Costa Rica (11.7%, a difference of 0.42%).
| Demographics | Rating | Rank | Female Disability |
| Immigrants | Romania | 99.5 /100 | #90 | Exceptional 11.6% |
| Immigrants | Zimbabwe | 99.5 /100 | #91 | Exceptional 11.6% |
| Immigrants | Czechoslovakia | 99.5 /100 | #92 | Exceptional 11.6% |
| Immigrants | Sierra Leone | 99.4 /100 | #93 | Exceptional 11.6% |
| Immigrants | Brazil | 99.4 /100 | #94 | Exceptional 11.6% |
| Immigrants | Northern Europe | 99.4 /100 | #95 | Exceptional 11.6% |
| Immigrants | Russia | 99.0 /100 | #96 | Exceptional 11.7% |
| Koreans | 99.0 /100 | #97 | Exceptional 11.7% |
| Uruguayans | 98.8 /100 | #98 | Exceptional 11.7% |
| Immigrants | Philippines | 98.6 /100 | #99 | Exceptional 11.7% |
| Immigrants | Uruguay | 98.5 /100 | #100 | Exceptional 11.7% |
| Immigrants | Costa Rica | 98.4 /100 | #101 | Exceptional 11.7% |
| Immigrants | South Eastern Asia | 98.4 /100 | #102 | Exceptional 11.7% |
| Immigrants | Eastern Africa | 98.3 /100 | #103 | Exceptional 11.7% |
| Immigrants | Western Asia | 98.3 /100 | #104 | Exceptional 11.7% |
Demographics Similar to Aleuts by Female Disability
In terms of female disability, the demographic groups most similar to Aleuts are Liberian (12.7%, a difference of 0.0%), British West Indian (12.7%, a difference of 0.030%), Immigrants from Armenia (12.7%, a difference of 0.080%), Subsaharan African (12.7%, a difference of 0.090%), and Immigrants from Germany (12.7%, a difference of 0.10%).
| Demographics | Rating | Rank | Female Disability |
| Crow | 1.6 /100 | #251 | Tragic 12.7% |
| Immigrants | Caribbean | 1.4 /100 | #252 | Tragic 12.7% |
| Jamaicans | 1.4 /100 | #253 | Tragic 12.7% |
| Hawaiians | 1.4 /100 | #254 | Tragic 12.7% |
| Immigrants | Germany | 1.3 /100 | #255 | Tragic 12.7% |
| British West Indians | 1.2 /100 | #256 | Tragic 12.7% |
| Liberians | 1.1 /100 | #257 | Tragic 12.7% |
| Aleuts | 1.1 /100 | #258 | Tragic 12.7% |
| Immigrants | Armenia | 1.0 /100 | #259 | Tragic 12.7% |
| Sub-Saharan Africans | 1.0 /100 | #260 | Tragic 12.7% |
| Bermudans | 1.0 /100 | #261 | Tragic 12.7% |
| Czechoslovakians | 0.9 /100 | #262 | Tragic 12.7% |
| Spaniards | 0.7 /100 | #263 | Tragic 12.8% |
| Alaska Natives | 0.6 /100 | #264 | Tragic 12.8% |
| West Indians | 0.5 /100 | #265 | Tragic 12.8% |