Immigrants from Russia vs Romanian Ambulatory Disability

COMPARE

Immigrants from Russia
Race
Ancestry
AfghanAfricanAlaska NativeAlaskan AthabascanAlbanianAleutAlsatianAmericanApacheArabArapahoArgentineanArmenianAssyrian/Chaldean/SyriacAustralianAustrianBahamianBangladeshiBarbadianBasqueBelgianBelizeanBermudanBhutaneseBlackfeetBolivianBrazilianBritishBritish West IndianBulgarianBurmeseCajunCambodianCanadianCape VerdeanCarpatho RusynCelticCentral AmericanCentral American IndianCherokeeCheyenneChickasawChileanChineseChippewaChoctawColombianColvilleComancheCosta RicanCreeCreekCroatianCrowCubanCypriotCzechCzechoslovakianDanishDelawareDominicanDutchDutch West IndianEastern EuropeanEcuadorianEgyptianEnglishEstonianEthiopianEuropeanFijianFilipinoFinnishFrenchFrench American IndianFrench CanadianGermanGerman RussianGhanaianGreekGuamanian/ChamorroGuatemalanGuyaneseHaitianHmongHonduranHopiHoumaHungarianIcelanderIndian (Asian)IndonesianInupiatIranianIraqiIrishIroquoisIsraeliItalianJamaicanJapaneseJordanianKenyanKiowaKoreanLaotianLatvianLebaneseLiberianLithuanianLumbeeLuxembourgerMacedonianMalaysianMalteseMarshalleseMenomineeMexicanMexican American IndianMongolianMoroccanNative HawaiianNavajoNepaleseNew ZealanderNicaraguanNigerianNorthern EuropeanNorwegianOkinawanOsageOttawaPaiutePakistaniPalestinianPanamanianParaguayanPennsylvania GermanPeruvianPimaPolishPortuguesePotawatomiPuebloPuerto RicanPuget Sound SalishRussianSalvadoranSamoanScandinavianScotch-IrishScottishSeminoleSenegaleseSerbianShoshoneSierra LeoneanSiouxSlavicSlovakSloveneSomaliSouth AfricanSouth AmericanSouth American IndianSoviet UnionSpaniardSpanishSpanish AmericanSpanish American IndianSri LankanSubsaharan AfricanSudaneseSwedishSwissSyrianTaiwaneseThaiTlingit-HaidaTohono O'OdhamTonganTrinidadian and TobagonianTsimshianTurkishU.S. Virgin IslanderUgandanUkrainianUruguayanUteVenezuelanVietnameseWelshWest IndianYakamaYaquiYugoslavianYumanYup'ikZimbabwean
Immigration
NonimmigrantsImmigrantsAfghanistanAfricaAlbaniaArgentinaArmeniaAsiaAustraliaAustriaBahamasBangladeshBarbadosBelarusBelgiumBelizeBoliviaBosnia and HerzegovinaBrazilBulgariaBurma/MyanmarCabo VerdeCambodiaCameroonCanadaCaribbeanCentral AmericaChileChinaColombiaCongoCosta RicaCroatiaCubaCzechoslovakiaDenmarkDominicaDominican RepublicEastern AfricaEastern AsiaEastern EuropeEcuadorEgyptEl SalvadorEnglandEritreaEthiopiaEuropeFijiFranceGermanyGhanaGreeceGrenadaGuatemalaGuyanaHaitiHondurasHong KongHungaryIndiaIndonesiaIranIraqIrelandIsraelItalyJamaicaJapanJordanKazakhstanKenyaKoreaKuwaitLaosLatin AmericaLatviaLebanonLiberiaLithuaniaMalaysiaMexicoMicronesiaMiddle AfricaMoldovaMoroccoNepalNetherlandsNicaraguaNigeriaNorth AmericaNorth MacedoniaNorthern AfricaNorthern EuropeNorwayOceaniaPakistanPanamaPeruPhilippinesPolandPortugalRomaniaRussiaSaudi ArabiaScotlandSenegalSerbiaSierra LeoneSingaporeSomaliaSouth AfricaSouth AmericaSouth Central AsiaSouth Eastern AsiaSouthern EuropeSpainSri LankaSt. Vincent and the GrenadinesSudanSwedenSwitzerlandSyriaTaiwanThailandTrinidad and TobagoTurkeyUgandaUkraineUruguayUzbekistanVenezuelaVietnamWest IndiesWestern AfricaWestern AsiaWestern EuropeYemenZaireZimbabweAzores
Romanian
Race
Ancestry
AfghanAfricanAlaska NativeAlaskan AthabascanAlbanianAleutAlsatianAmericanApacheArabArapahoArgentineanArmenianAssyrian/Chaldean/SyriacAustralianAustrianBahamianBangladeshiBarbadianBasqueBelgianBelizeanBermudanBhutaneseBlackfeetBolivianBrazilianBritishBritish West IndianBulgarianBurmeseCajunCambodianCanadianCape VerdeanCarpatho RusynCelticCentral AmericanCentral American IndianCherokeeCheyenneChickasawChileanChineseChippewaChoctawColombianColvilleComancheCosta RicanCreeCreekCroatianCrowCubanCypriotCzechCzechoslovakianDanishDelawareDominicanDutchDutch West IndianEastern EuropeanEcuadorianEgyptianEnglishEstonianEthiopianEuropeanFijianFilipinoFinnishFrenchFrench American IndianFrench CanadianGermanGerman RussianGhanaianGreekGuamanian/ChamorroGuatemalanGuyaneseHaitianHmongHonduranHopiHoumaHungarianIcelanderIndian (Asian)IndonesianInupiatIranianIraqiIrishIroquoisIsraeliItalianJamaicanJapaneseJordanianKenyanKiowaKoreanLaotianLatvianLebaneseLiberianLithuanianLumbeeLuxembourgerMacedonianMalaysianMalteseMarshalleseMenomineeMexicanMexican American IndianMongolianMoroccanNative HawaiianNavajoNepaleseNew ZealanderNicaraguanNigerianNorthern EuropeanNorwegianOkinawanOsageOttawaPaiutePakistaniPalestinianPanamanianParaguayanPennsylvania GermanPeruvianPimaPolishPortuguesePotawatomiPuebloPuerto RicanPuget Sound SalishRomanianRussianSalvadoranSamoanScandinavianScotch-IrishScottishSeminoleSenegaleseSerbianShoshoneSierra LeoneanSiouxSlavicSlovakSloveneSomaliSouth AfricanSouth AmericanSouth American IndianSoviet UnionSpaniardSpanishSpanish AmericanSpanish American IndianSri LankanSubsaharan AfricanSudaneseSwedishSwissSyrianTaiwaneseThaiTlingit-HaidaTohono O'OdhamTonganTrinidadian and TobagonianTsimshianTurkishU.S. Virgin IslanderUgandanUkrainianUruguayanUteVenezuelanVietnameseWelshWest IndianYakamaYaquiYugoslavianYumanYup'ikZimbabwean
Immigration
NonimmigrantsImmigrantsAfghanistanAfricaAlbaniaArgentinaArmeniaAsiaAustraliaAustriaBahamasBangladeshBarbadosBelarusBelgiumBelizeBoliviaBosnia and HerzegovinaBrazilBulgariaBurma/MyanmarCabo VerdeCambodiaCameroonCanadaCaribbeanCentral AmericaChileChinaColombiaCongoCosta RicaCroatiaCubaCzechoslovakiaDenmarkDominicaDominican RepublicEastern AfricaEastern AsiaEastern EuropeEcuadorEgyptEl SalvadorEnglandEritreaEthiopiaEuropeFijiFranceGermanyGhanaGreeceGrenadaGuatemalaGuyanaHaitiHondurasHong KongHungaryIndiaIndonesiaIranIraqIrelandIsraelItalyJamaicaJapanJordanKazakhstanKenyaKoreaKuwaitLaosLatin AmericaLatviaLebanonLiberiaLithuaniaMalaysiaMexicoMicronesiaMiddle AfricaMoldovaMoroccoNepalNetherlandsNicaraguaNigeriaNorth AmericaNorth MacedoniaNorthern AfricaNorthern EuropeNorwayOceaniaPakistanPanamaPeruPhilippinesPolandPortugalRomaniaSaudi ArabiaScotlandSenegalSerbiaSierra LeoneSingaporeSomaliaSouth AfricaSouth AmericaSouth Central AsiaSouth Eastern AsiaSouthern EuropeSpainSri LankaSt. Vincent and the GrenadinesSudanSwedenSwitzerlandSyriaTaiwanThailandTrinidad and TobagoTurkeyUgandaUkraineUruguayUzbekistanVenezuelaVietnamWest IndiesWestern AfricaWestern AsiaWestern EuropeYemenZaireZimbabweAzores
Ambulatory Disability
Income
Poverty
Unemployment
Labor Participation
Family Structure
Vehicle Availability
Education Level
Disability

Ambulatory Disability Comparison

Immigrants from Russia

Romanians

Exceptional
Excellent
5.9%
AMBULATORY DISABILITY
92.4/ 100
METRIC RATING
123rd/ 347
METRIC RANK
6.0%
AMBULATORY DISABILITY
82.9/ 100
METRIC RATING
143rd/ 347
METRIC RANK

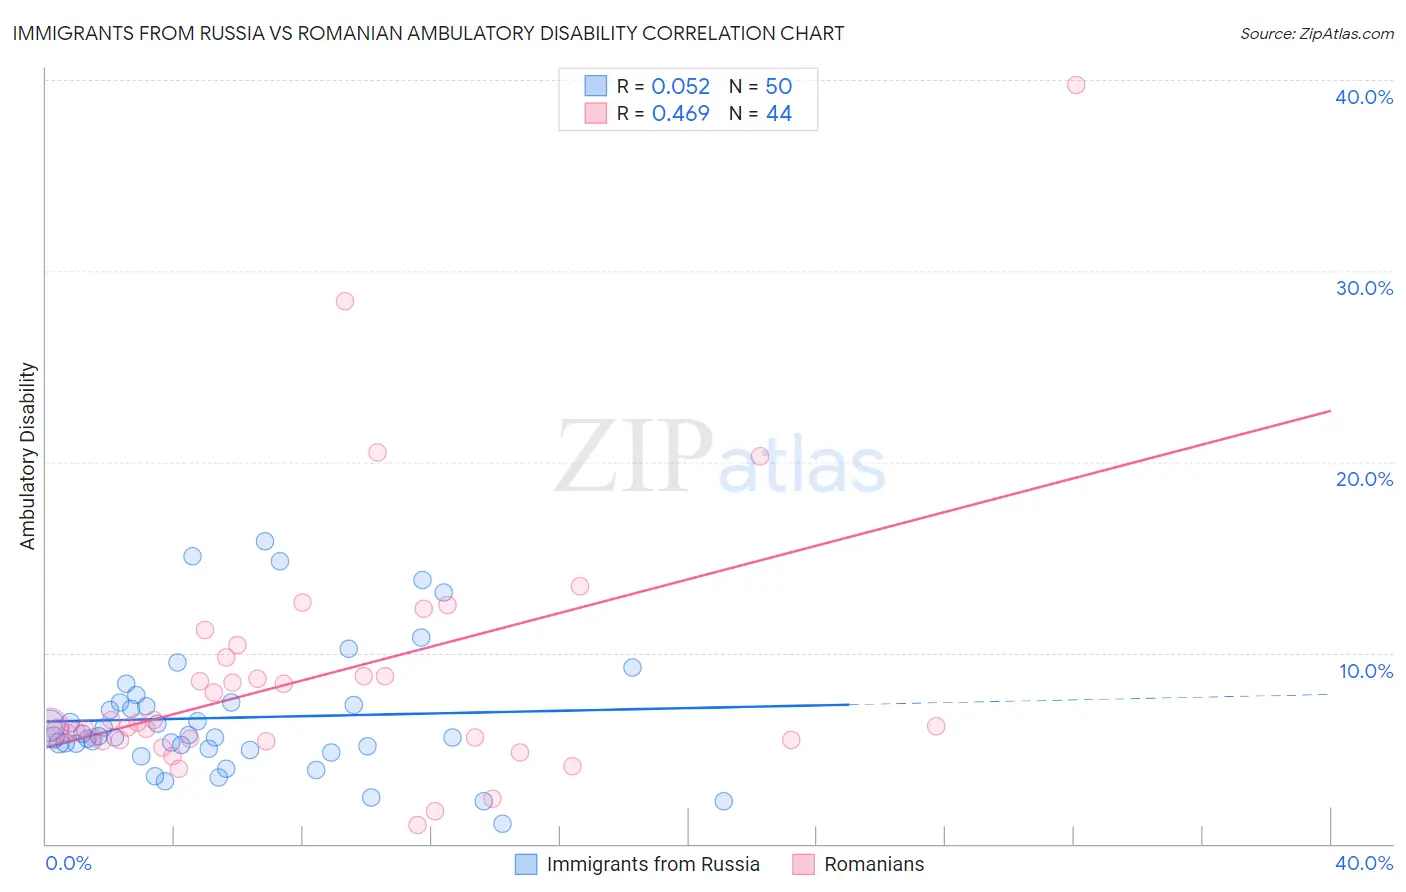
Immigrants from Russia vs Romanian Ambulatory Disability Correlation Chart

The statistical analysis conducted on geographies consisting of 347,844,445 people shows a slight positive correlation between the proportion of Immigrants from Russia and percentage of population with ambulatory disability in the United States with a correlation coefficient (R) of 0.052 and weighted average of 5.9%. Similarly, the statistical analysis conducted on geographies consisting of 377,793,215 people shows a moderate positive correlation between the proportion of Romanians and percentage of population with ambulatory disability in the United States with a correlation coefficient (R) of 0.469 and weighted average of 6.0%, a difference of 1.3%.
Immigrants from Russia vs Romanian Ambulatory Disability

Ambulatory Disability Correlation Summary

MeasurementImmigrants from RussiaRomanian
Minimum1.0%1.00%
Maximum15.9%39.7%
Range14.8%38.7%
Mean6.6%8.7%
Median5.6%6.2%
Interquartile 25% (IQ1)5.0%5.4%
Interquartile 75% (IQ3)7.4%9.3%
Interquartile Range (IQR)2.4%3.8%
Standard Deviation (Sample)3.3%7.0%
Standard Deviation (Population)3.3%6.9%

Demographics Similar to Immigrants from Russia and Romanians by Ambulatory Disability

In terms of ambulatory disability, the demographic groups most similar to Immigrants from Russia are Immigrants from Middle Africa (5.9%, a difference of 0.040%), Korean (5.9%, a difference of 0.16%), Arab (5.9%, a difference of 0.18%), Immigrants from Nigeria (5.9%, a difference of 0.28%), and Immigrants from Western Asia (5.9%, a difference of 0.31%). Similarly, the demographic groups most similar to Romanians are Immigrants from Philippines (6.0%, a difference of 0.010%), Swedish (6.0%, a difference of 0.020%), Czech (6.0%, a difference of 0.040%), Immigrants from Zaire (6.0%, a difference of 0.070%), and Immigrants from Hungary (6.0%, a difference of 0.090%).
DemographicsRating | RankAmbulatory Disability
Immigrants | Russia
92.4
/100
|
#123
Exceptional
5.9%
Immigrants | Middle Africa
92.2
/100
|
#124
Exceptional
5.9%
Koreans
91.6
/100
|
#125
Exceptional
5.9%
Arabs
91.5
/100
|
#126
Exceptional
5.9%
Immigrants | Nigeria
90.9
/100
|
#127
Exceptional
5.9%
Immigrants | Western Asia
90.7
/100
|
#128
Exceptional
5.9%
Immigrants | Norway
90.5
/100
|
#129
Exceptional
5.9%
Immigrants | Kazakhstan
89.7
/100
|
#130
Excellent
5.9%
Immigrants | Costa Rica
89.5
/100
|
#131
Excellent
5.9%
Immigrants | Europe
87.8
/100
|
#132
Excellent
6.0%
Immigrants | Immigrants
86.9
/100
|
#133
Excellent
6.0%
Ute
86.6
/100
|
#134
Excellent
6.0%
Immigrants | Italy
85.0
/100
|
#135
Excellent
6.0%
Immigrants | North Macedonia
84.1
/100
|
#136
Excellent
6.0%
Immigrants | Syria
84.1
/100
|
#137
Excellent
6.0%
Immigrants | Hungary
83.9
/100
|
#138
Excellent
6.0%
Immigrants | Zaire
83.6
/100
|
#139
Excellent
6.0%
Czechs
83.3
/100
|
#140
Excellent
6.0%
Swedes
83.1
/100
|
#141
Excellent
6.0%
Immigrants | Philippines
83.0
/100
|
#142
Excellent
6.0%
Romanians
82.9
/100
|
#143
Excellent
6.0%