Immigrants from Western Europe vs Romanian Ambulatory Disability
COMPARE
Immigrants from Western Europe
Romanian
Ambulatory Disability
Ambulatory Disability Comparison
Immigrants from Western Europe
Romanians
6.2%
AMBULATORY DISABILITY
31.6/ 100
METRIC RATING
192nd/ 347
METRIC RANK
6.0%
AMBULATORY DISABILITY
82.9/ 100
METRIC RATING
143rd/ 347
METRIC RANK
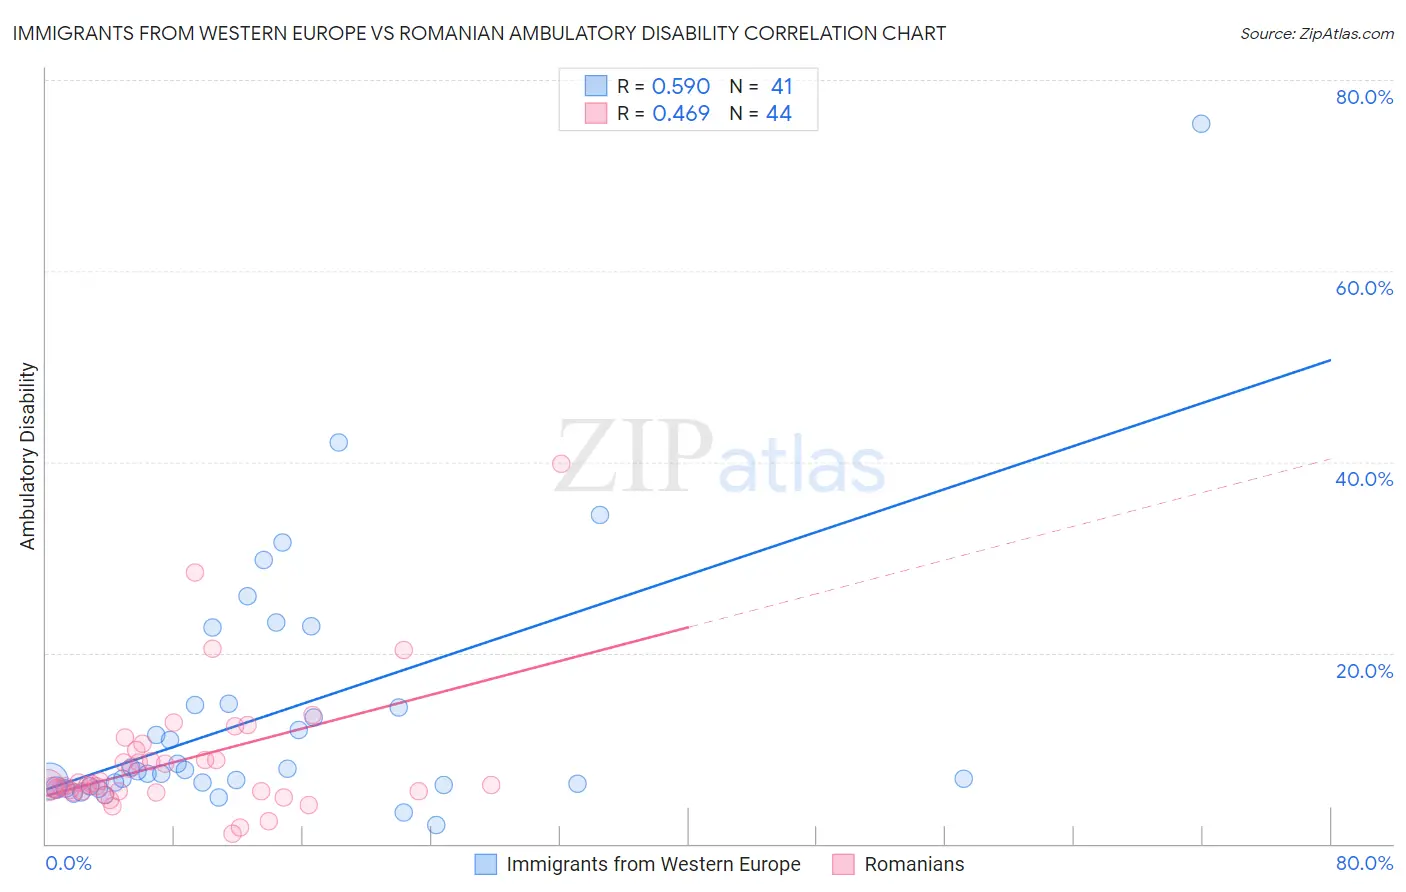
Immigrants from Western Europe vs Romanian Ambulatory Disability Correlation Chart
The statistical analysis conducted on geographies consisting of 493,880,740 people shows a substantial positive correlation between the proportion of Immigrants from Western Europe and percentage of population with ambulatory disability in the United States with a correlation coefficient (R) of 0.590 and weighted average of 6.2%. Similarly, the statistical analysis conducted on geographies consisting of 377,793,215 people shows a moderate positive correlation between the proportion of Romanians and percentage of population with ambulatory disability in the United States with a correlation coefficient (R) of 0.469 and weighted average of 6.0%, a difference of 3.2%.
Ambulatory Disability Correlation Summary
| Measurement | Immigrants from Western Europe | Romanian |
| Minimum | 1.9% | 1.00% |
| Maximum | 75.4% | 39.7% |
| Range | 73.5% | 38.7% |
| Mean | 13.5% | 8.7% |
| Median | 7.6% | 6.2% |
| Interquartile 25% (IQ1) | 6.1% | 5.4% |
| Interquartile 75% (IQ3) | 14.6% | 9.3% |
| Interquartile Range (IQR) | 8.5% | 3.8% |
| Standard Deviation (Sample) | 13.7% | 7.0% |
| Standard Deviation (Population) | 13.5% | 6.9% |
Similar Demographics by Ambulatory Disability
Demographics Similar to Immigrants from Western Europe by Ambulatory Disability
In terms of ambulatory disability, the demographic groups most similar to Immigrants from Western Europe are Immigrants from Guatemala (6.2%, a difference of 0.020%), Immigrants from Western Africa (6.2%, a difference of 0.10%), Guatemalan (6.2%, a difference of 0.10%), Alaska Native (6.2%, a difference of 0.11%), and Ukrainian (6.2%, a difference of 0.14%).
| Demographics | Rating | Rank | Ambulatory Disability |
| Immigrants | Bosnia and Herzegovina | 37.2 /100 | #185 | Fair 6.2% |
| Europeans | 36.2 /100 | #186 | Fair 6.2% |
| Carpatho Rusyns | 35.3 /100 | #187 | Fair 6.2% |
| British | 34.3 /100 | #188 | Fair 6.2% |
| Ukrainians | 34.0 /100 | #189 | Fair 6.2% |
| Immigrants | Western Africa | 33.4 /100 | #190 | Fair 6.2% |
| Immigrants | Guatemala | 31.9 /100 | #191 | Fair 6.2% |
| Immigrants | Western Europe | 31.6 /100 | #192 | Fair 6.2% |
| Guatemalans | 30.0 /100 | #193 | Fair 6.2% |
| Alaska Natives | 29.8 /100 | #194 | Fair 6.2% |
| Belgians | 28.6 /100 | #195 | Fair 6.2% |
| Malaysians | 28.2 /100 | #196 | Fair 6.2% |
| Poles | 26.3 /100 | #197 | Fair 6.2% |
| Immigrants | Bangladesh | 24.6 /100 | #198 | Fair 6.2% |
| Italians | 22.6 /100 | #199 | Fair 6.2% |
Demographics Similar to Romanians by Ambulatory Disability
In terms of ambulatory disability, the demographic groups most similar to Romanians are Immigrants from Philippines (6.0%, a difference of 0.010%), Macedonian (6.0%, a difference of 0.010%), Swedish (6.0%, a difference of 0.020%), Czech (6.0%, a difference of 0.040%), and Pakistani (6.0%, a difference of 0.040%).
| Demographics | Rating | Rank | Ambulatory Disability |
| Immigrants | North Macedonia | 84.1 /100 | #136 | Excellent 6.0% |
| Immigrants | Syria | 84.1 /100 | #137 | Excellent 6.0% |
| Immigrants | Hungary | 83.9 /100 | #138 | Excellent 6.0% |
| Immigrants | Zaire | 83.6 /100 | #139 | Excellent 6.0% |
| Czechs | 83.3 /100 | #140 | Excellent 6.0% |
| Swedes | 83.1 /100 | #141 | Excellent 6.0% |
| Immigrants | Philippines | 83.0 /100 | #142 | Excellent 6.0% |
| Romanians | 82.9 /100 | #143 | Excellent 6.0% |
| Macedonians | 82.8 /100 | #144 | Excellent 6.0% |
| Pakistanis | 82.5 /100 | #145 | Excellent 6.0% |
| Immigrants | Greece | 82.5 /100 | #146 | Excellent 6.0% |
| Immigrants | Moldova | 82.4 /100 | #147 | Excellent 6.0% |
| Immigrants | Eastern Europe | 82.0 /100 | #148 | Excellent 6.0% |
| Lithuanians | 81.9 /100 | #149 | Excellent 6.0% |
| Maltese | 81.6 /100 | #150 | Excellent 6.0% |