Kenyan vs Immigrants from Denmark Disability
COMPARE
Kenyan
Immigrants from Denmark
Disability
Disability Comparison
Kenyans
Immigrants from Denmark
11.5%
DISABILITY
87.1/ 100
METRIC RATING
137th/ 347
METRIC RANK
11.3%
DISABILITY
95.6/ 100
METRIC RATING
110th/ 347
METRIC RANK
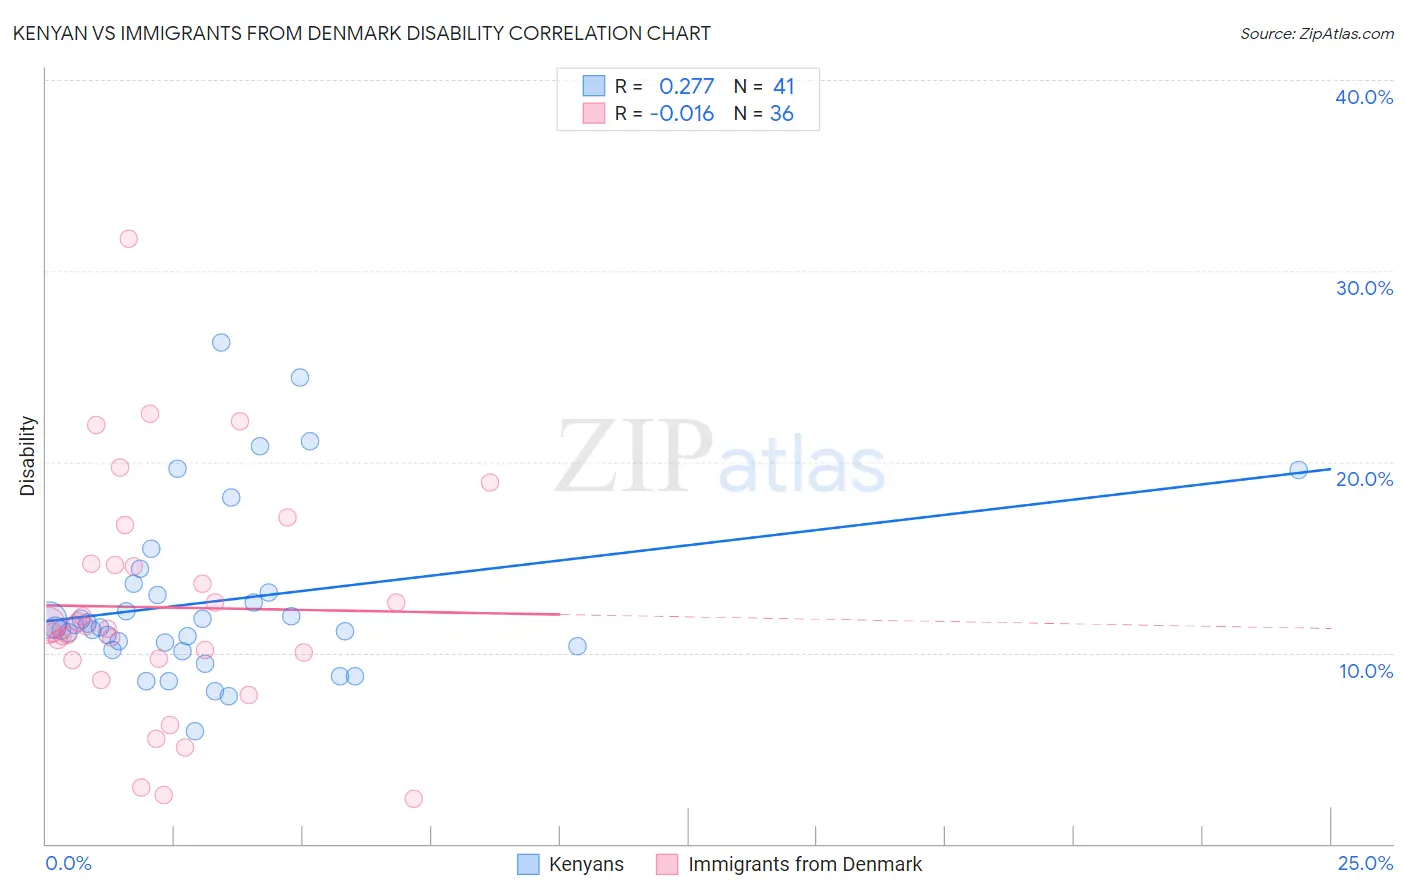
Kenyan vs Immigrants from Denmark Disability Correlation Chart
The statistical analysis conducted on geographies consisting of 168,214,038 people shows a weak positive correlation between the proportion of Kenyans and percentage of population with a disability in the United States with a correlation coefficient (R) of 0.277 and weighted average of 11.5%. Similarly, the statistical analysis conducted on geographies consisting of 136,432,465 people shows no correlation between the proportion of Immigrants from Denmark and percentage of population with a disability in the United States with a correlation coefficient (R) of -0.016 and weighted average of 11.3%, a difference of 1.3%.
Disability Correlation Summary
| Measurement | Kenyan | Immigrants from Denmark |
| Minimum | 5.9% | 2.4% |
| Maximum | 26.2% | 31.7% |
| Range | 20.3% | 29.3% |
| Mean | 12.7% | 12.4% |
| Median | 11.3% | 11.3% |
| Interquartile 25% (IQ1) | 10.2% | 9.6% |
| Interquartile 75% (IQ3) | 13.4% | 14.7% |
| Interquartile Range (IQR) | 3.2% | 5.0% |
| Standard Deviation (Sample) | 4.5% | 6.1% |
| Standard Deviation (Population) | 4.5% | 6.0% |
Similar Demographics by Disability
Demographics Similar to Kenyans by Disability
In terms of disability, the demographic groups most similar to Kenyans are New Zealander (11.5%, a difference of 0.010%), Ghanaian (11.5%, a difference of 0.010%), Russian (11.5%, a difference of 0.030%), Immigrants from St. Vincent and the Grenadines (11.4%, a difference of 0.070%), and Ugandan (11.4%, a difference of 0.080%).
| Demographics | Rating | Rank | Disability |
| Latvians | 89.8 /100 | #130 | Excellent 11.4% |
| Immigrants | Croatia | 89.8 /100 | #131 | Excellent 11.4% |
| Immigrants | Africa | 89.3 /100 | #132 | Excellent 11.4% |
| Arabs | 89.1 /100 | #133 | Excellent 11.4% |
| Immigrants | Guyana | 88.3 /100 | #134 | Excellent 11.4% |
| Ugandans | 87.9 /100 | #135 | Excellent 11.4% |
| Immigrants | St. Vincent and the Grenadines | 87.8 /100 | #136 | Excellent 11.4% |
| Kenyans | 87.1 /100 | #137 | Excellent 11.5% |
| New Zealanders | 87.0 /100 | #138 | Excellent 11.5% |
| Ghanaians | 87.0 /100 | #139 | Excellent 11.5% |
| Russians | 86.8 /100 | #140 | Excellent 11.5% |
| Immigrants | Grenada | 86.1 /100 | #141 | Excellent 11.5% |
| Immigrants | Sudan | 85.3 /100 | #142 | Excellent 11.5% |
| Moroccans | 83.3 /100 | #143 | Excellent 11.5% |
| Australians | 82.5 /100 | #144 | Excellent 11.5% |
Demographics Similar to Immigrants from Denmark by Disability
In terms of disability, the demographic groups most similar to Immigrants from Denmark are Immigrants from Uganda (11.3%, a difference of 0.020%), Immigrants from South Eastern Asia (11.3%, a difference of 0.070%), Immigrants from Nigeria (11.3%, a difference of 0.10%), Nicaraguan (11.3%, a difference of 0.18%), and Immigrants from Uzbekistan (11.3%, a difference of 0.18%).
| Demographics | Rating | Rank | Disability |
| Immigrants | Uruguay | 96.4 /100 | #103 | Exceptional 11.3% |
| Immigrants | Immigrants | 96.4 /100 | #104 | Exceptional 11.3% |
| Immigrants | Kazakhstan | 96.4 /100 | #105 | Exceptional 11.3% |
| Immigrants | Eastern Europe | 96.3 /100 | #106 | Exceptional 11.3% |
| Nicaraguans | 96.2 /100 | #107 | Exceptional 11.3% |
| Immigrants | Nigeria | 96.0 /100 | #108 | Exceptional 11.3% |
| Immigrants | Uganda | 95.7 /100 | #109 | Exceptional 11.3% |
| Immigrants | Denmark | 95.6 /100 | #110 | Exceptional 11.3% |
| Immigrants | South Eastern Asia | 95.4 /100 | #111 | Exceptional 11.3% |
| Immigrants | Uzbekistan | 94.9 /100 | #112 | Exceptional 11.3% |
| Guyanese | 94.7 /100 | #113 | Exceptional 11.3% |
| Immigrants | Syria | 94.7 /100 | #114 | Exceptional 11.3% |
| Immigrants | Philippines | 94.6 /100 | #115 | Exceptional 11.3% |
| Immigrants | Northern Europe | 94.1 /100 | #116 | Exceptional 11.3% |
| Luxembourgers | 93.9 /100 | #117 | Exceptional 11.3% |