Kenyan vs Vietnamese Disability
COMPARE
Kenyan
Vietnamese
Disability
Disability Comparison
Kenyans
Vietnamese
11.5%
DISABILITY
87.1/ 100
METRIC RATING
137th/ 347
METRIC RANK
10.9%
DISABILITY
99.9/ 100
METRIC RATING
49th/ 347
METRIC RANK
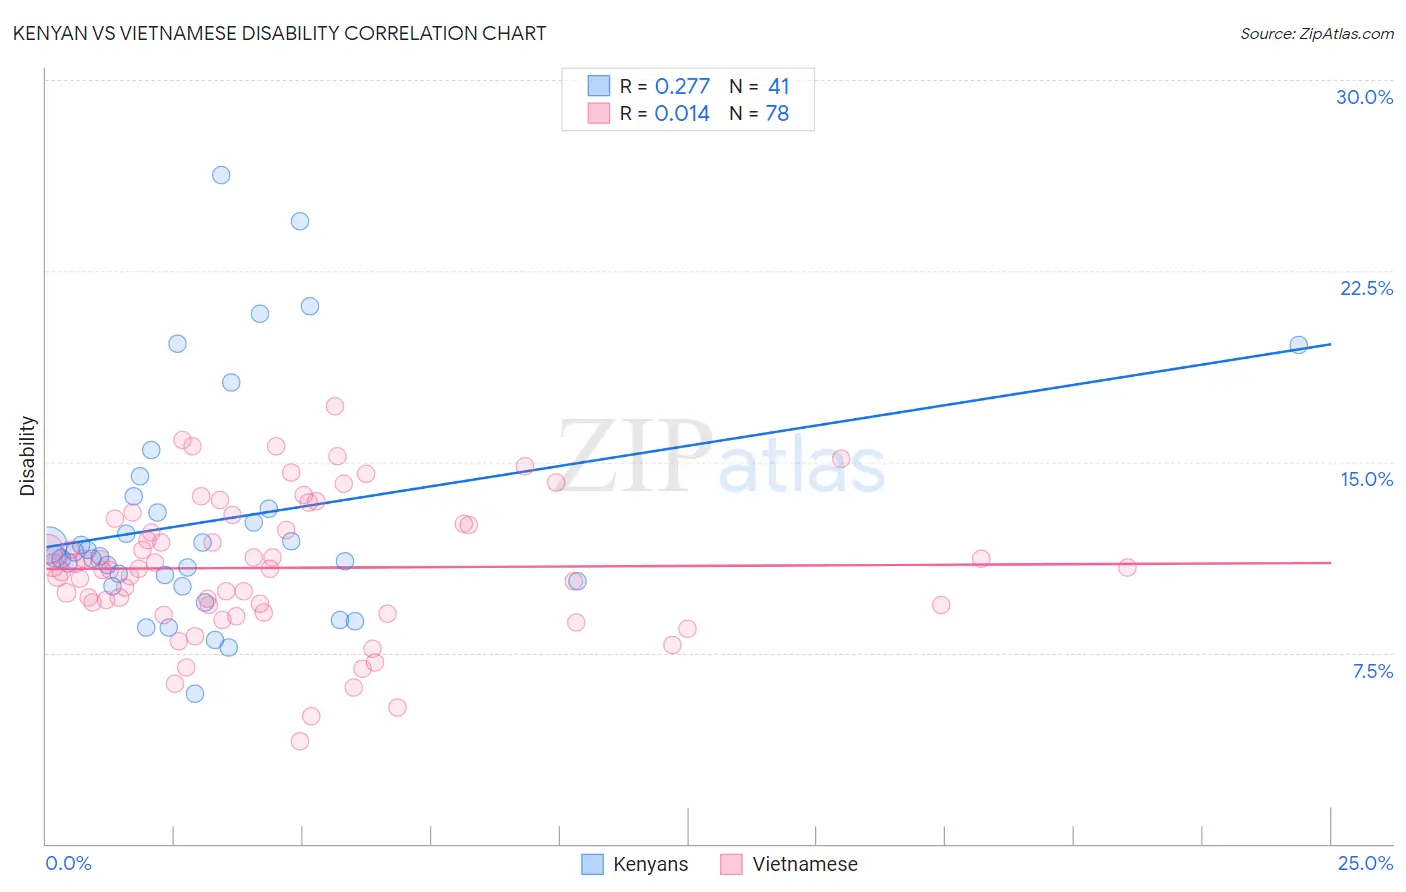
Kenyan vs Vietnamese Disability Correlation Chart
The statistical analysis conducted on geographies consisting of 168,214,038 people shows a weak positive correlation between the proportion of Kenyans and percentage of population with a disability in the United States with a correlation coefficient (R) of 0.277 and weighted average of 11.5%. Similarly, the statistical analysis conducted on geographies consisting of 170,758,607 people shows no correlation between the proportion of Vietnamese and percentage of population with a disability in the United States with a correlation coefficient (R) of 0.014 and weighted average of 10.9%, a difference of 5.5%.
Disability Correlation Summary
| Measurement | Kenyan | Vietnamese |
| Minimum | 5.9% | 4.0% |
| Maximum | 26.2% | 17.2% |
| Range | 20.3% | 13.2% |
| Mean | 12.7% | 10.8% |
| Median | 11.3% | 10.8% |
| Interquartile 25% (IQ1) | 10.2% | 9.4% |
| Interquartile 75% (IQ3) | 13.4% | 12.6% |
| Interquartile Range (IQR) | 3.2% | 3.2% |
| Standard Deviation (Sample) | 4.5% | 2.7% |
| Standard Deviation (Population) | 4.5% | 2.7% |
Similar Demographics by Disability
Demographics Similar to Kenyans by Disability
In terms of disability, the demographic groups most similar to Kenyans are New Zealander (11.5%, a difference of 0.010%), Ghanaian (11.5%, a difference of 0.010%), Russian (11.5%, a difference of 0.030%), Immigrants from St. Vincent and the Grenadines (11.4%, a difference of 0.070%), and Ugandan (11.4%, a difference of 0.080%).
| Demographics | Rating | Rank | Disability |
| Latvians | 89.8 /100 | #130 | Excellent 11.4% |
| Immigrants | Croatia | 89.8 /100 | #131 | Excellent 11.4% |
| Immigrants | Africa | 89.3 /100 | #132 | Excellent 11.4% |
| Arabs | 89.1 /100 | #133 | Excellent 11.4% |
| Immigrants | Guyana | 88.3 /100 | #134 | Excellent 11.4% |
| Ugandans | 87.9 /100 | #135 | Excellent 11.4% |
| Immigrants | St. Vincent and the Grenadines | 87.8 /100 | #136 | Excellent 11.4% |
| Kenyans | 87.1 /100 | #137 | Excellent 11.5% |
| New Zealanders | 87.0 /100 | #138 | Excellent 11.5% |
| Ghanaians | 87.0 /100 | #139 | Excellent 11.5% |
| Russians | 86.8 /100 | #140 | Excellent 11.5% |
| Immigrants | Grenada | 86.1 /100 | #141 | Excellent 11.5% |
| Immigrants | Sudan | 85.3 /100 | #142 | Excellent 11.5% |
| Moroccans | 83.3 /100 | #143 | Excellent 11.5% |
| Australians | 82.5 /100 | #144 | Excellent 11.5% |
Demographics Similar to Vietnamese by Disability
In terms of disability, the demographic groups most similar to Vietnamese are Immigrants from Saudi Arabia (10.9%, a difference of 0.0%), Peruvian (10.9%, a difference of 0.010%), Soviet Union (10.9%, a difference of 0.060%), South American (10.9%, a difference of 0.070%), and Immigrants from Spain (10.9%, a difference of 0.090%).
| Demographics | Rating | Rank | Disability |
| Immigrants | Nepal | 99.9 /100 | #42 | Exceptional 10.8% |
| Israelis | 99.9 /100 | #43 | Exceptional 10.8% |
| Immigrants | Japan | 99.9 /100 | #44 | Exceptional 10.8% |
| Immigrants | Peru | 99.9 /100 | #45 | Exceptional 10.8% |
| Tongans | 99.9 /100 | #46 | Exceptional 10.8% |
| Taiwanese | 99.9 /100 | #47 | Exceptional 10.8% |
| Soviet Union | 99.9 /100 | #48 | Exceptional 10.9% |
| Vietnamese | 99.9 /100 | #49 | Exceptional 10.9% |
| Immigrants | Saudi Arabia | 99.9 /100 | #50 | Exceptional 10.9% |
| Peruvians | 99.8 /100 | #51 | Exceptional 10.9% |
| South Americans | 99.8 /100 | #52 | Exceptional 10.9% |
| Immigrants | Spain | 99.8 /100 | #53 | Exceptional 10.9% |
| Jordanians | 99.8 /100 | #54 | Exceptional 10.9% |
| Immigrants | El Salvador | 99.8 /100 | #55 | Exceptional 10.9% |
| Immigrants | Lithuania | 99.8 /100 | #56 | Exceptional 10.9% |