Kenyan vs Potawatomi Disability
COMPARE
Kenyan
Potawatomi
Disability
Disability Comparison
Kenyans
Potawatomi
11.5%
DISABILITY
87.1/ 100
METRIC RATING
137th/ 347
METRIC RANK
14.2%
DISABILITY
0.0/ 100
METRIC RATING
329th/ 347
METRIC RANK
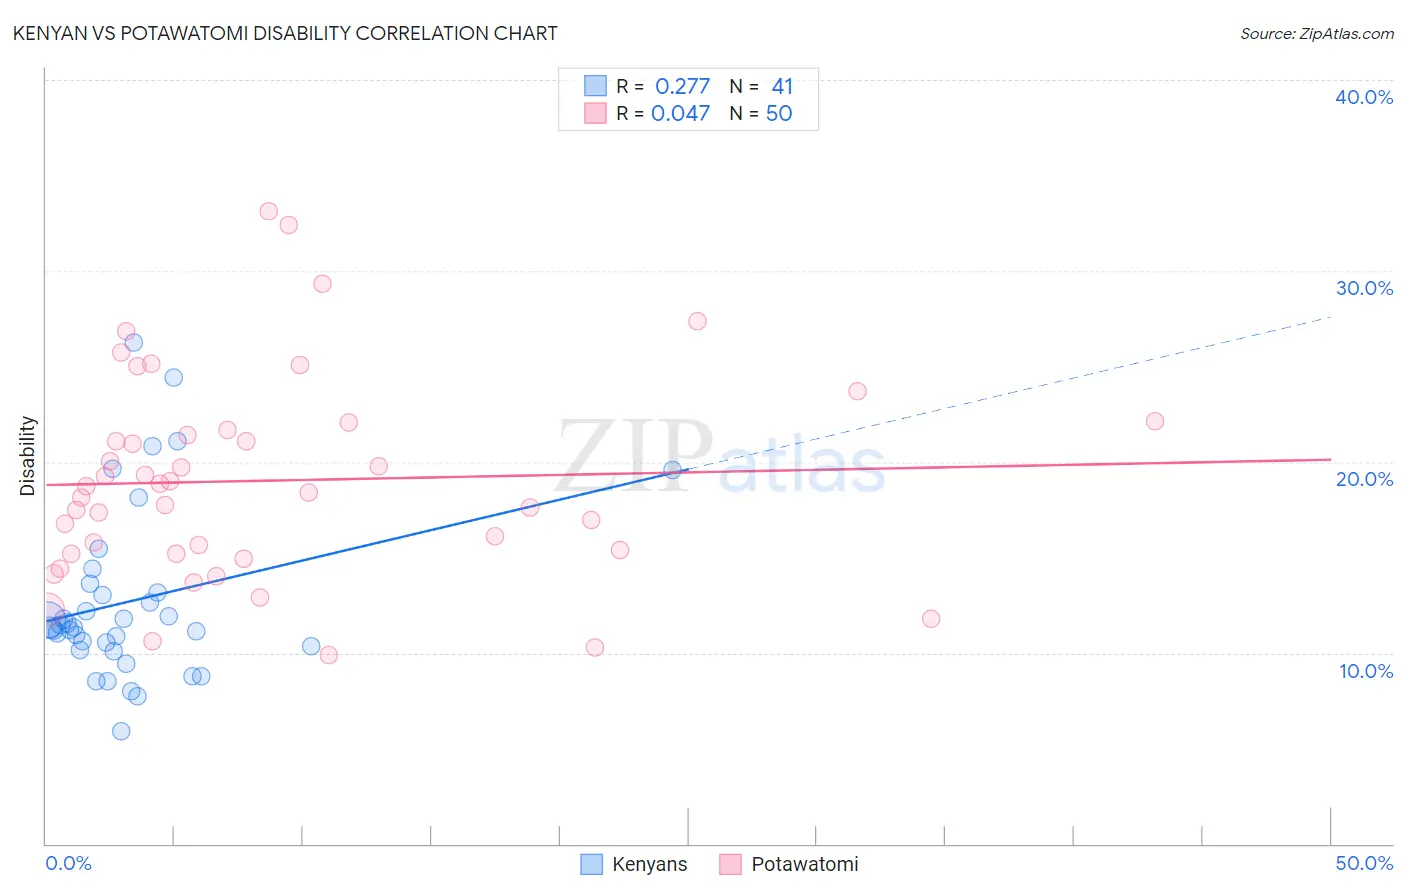
Kenyan vs Potawatomi Disability Correlation Chart
The statistical analysis conducted on geographies consisting of 168,214,038 people shows a weak positive correlation between the proportion of Kenyans and percentage of population with a disability in the United States with a correlation coefficient (R) of 0.277 and weighted average of 11.5%. Similarly, the statistical analysis conducted on geographies consisting of 117,767,457 people shows no correlation between the proportion of Potawatomi and percentage of population with a disability in the United States with a correlation coefficient (R) of 0.047 and weighted average of 14.2%, a difference of 23.8%.
Disability Correlation Summary
| Measurement | Kenyan | Potawatomi |
| Minimum | 5.9% | 9.9% |
| Maximum | 26.2% | 33.1% |
| Range | 20.3% | 23.2% |
| Mean | 12.7% | 19.0% |
| Median | 11.3% | 18.5% |
| Interquartile 25% (IQ1) | 10.2% | 15.2% |
| Interquartile 75% (IQ3) | 13.4% | 21.7% |
| Interquartile Range (IQR) | 3.2% | 6.5% |
| Standard Deviation (Sample) | 4.5% | 5.4% |
| Standard Deviation (Population) | 4.5% | 5.3% |
Similar Demographics by Disability
Demographics Similar to Kenyans by Disability
In terms of disability, the demographic groups most similar to Kenyans are New Zealander (11.5%, a difference of 0.010%), Ghanaian (11.5%, a difference of 0.010%), Russian (11.5%, a difference of 0.030%), Immigrants from St. Vincent and the Grenadines (11.4%, a difference of 0.070%), and Ugandan (11.4%, a difference of 0.080%).
| Demographics | Rating | Rank | Disability |
| Latvians | 89.8 /100 | #130 | Excellent 11.4% |
| Immigrants | Croatia | 89.8 /100 | #131 | Excellent 11.4% |
| Immigrants | Africa | 89.3 /100 | #132 | Excellent 11.4% |
| Arabs | 89.1 /100 | #133 | Excellent 11.4% |
| Immigrants | Guyana | 88.3 /100 | #134 | Excellent 11.4% |
| Ugandans | 87.9 /100 | #135 | Excellent 11.4% |
| Immigrants | St. Vincent and the Grenadines | 87.8 /100 | #136 | Excellent 11.4% |
| Kenyans | 87.1 /100 | #137 | Excellent 11.5% |
| New Zealanders | 87.0 /100 | #138 | Excellent 11.5% |
| Ghanaians | 87.0 /100 | #139 | Excellent 11.5% |
| Russians | 86.8 /100 | #140 | Excellent 11.5% |
| Immigrants | Grenada | 86.1 /100 | #141 | Excellent 11.5% |
| Immigrants | Sudan | 85.3 /100 | #142 | Excellent 11.5% |
| Moroccans | 83.3 /100 | #143 | Excellent 11.5% |
| Australians | 82.5 /100 | #144 | Excellent 11.5% |
Demographics Similar to Potawatomi by Disability
In terms of disability, the demographic groups most similar to Potawatomi are Ottawa (14.2%, a difference of 0.12%), Immigrants from the Azores (14.2%, a difference of 0.12%), Osage (14.2%, a difference of 0.14%), Native/Alaskan (14.2%, a difference of 0.17%), and Chippewa (14.1%, a difference of 0.22%).
| Demographics | Rating | Rank | Disability |
| Americans | 0.0 /100 | #322 | Tragic 13.9% |
| Comanche | 0.0 /100 | #323 | Tragic 14.1% |
| Chippewa | 0.0 /100 | #324 | Tragic 14.1% |
| Natives/Alaskans | 0.0 /100 | #325 | Tragic 14.2% |
| Osage | 0.0 /100 | #326 | Tragic 14.2% |
| Ottawa | 0.0 /100 | #327 | Tragic 14.2% |
| Immigrants | Azores | 0.0 /100 | #328 | Tragic 14.2% |
| Potawatomi | 0.0 /100 | #329 | Tragic 14.2% |
| Navajo | 0.0 /100 | #330 | Tragic 14.3% |
| Alaskan Athabascans | 0.0 /100 | #331 | Tragic 14.4% |
| Pueblo | 0.0 /100 | #332 | Tragic 14.4% |
| Cajuns | 0.0 /100 | #333 | Tragic 14.6% |
| Yuman | 0.0 /100 | #334 | Tragic 14.6% |
| Tohono O'odham | 0.0 /100 | #335 | Tragic 14.8% |
| Cherokee | 0.0 /100 | #336 | Tragic 14.8% |