Kenyan vs English Births to Unmarried Women
COMPARE
Kenyan
English
Births to Unmarried Women
Births to Unmarried Women Comparison
Kenyans
English
31.9%
BIRTHS TO UNMARRIED WOMEN
43.0/ 100
METRIC RATING
182nd/ 347
METRIC RANK
31.7%
BIRTHS TO UNMARRIED WOMEN
47.4/ 100
METRIC RATING
178th/ 347
METRIC RANK
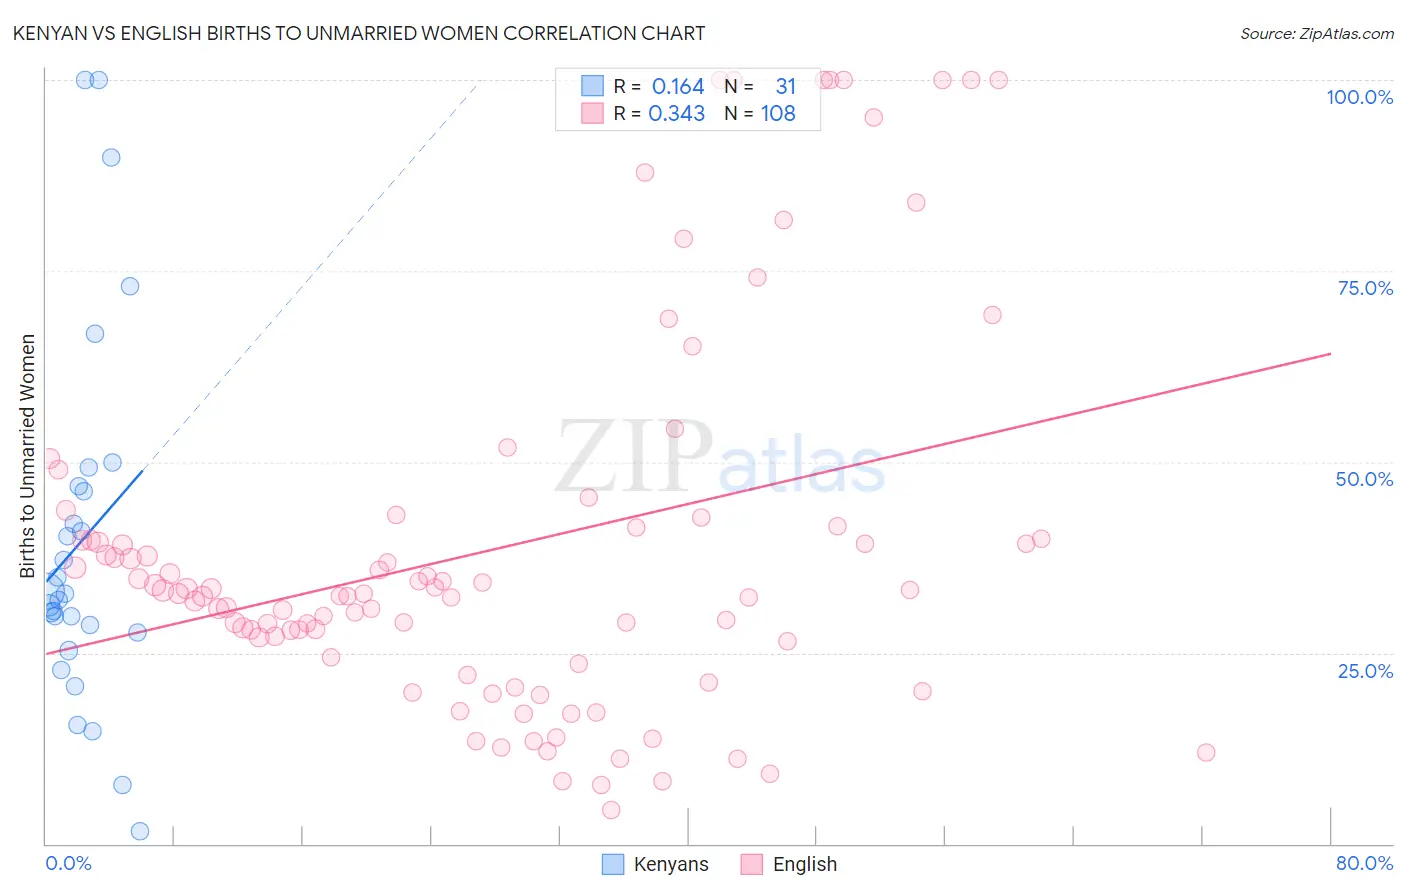
Kenyan vs English Births to Unmarried Women Correlation Chart
The statistical analysis conducted on geographies consisting of 163,852,803 people shows a poor positive correlation between the proportion of Kenyans and percentage of births to unmarried women in the United States with a correlation coefficient (R) of 0.164 and weighted average of 31.9%. Similarly, the statistical analysis conducted on geographies consisting of 509,798,956 people shows a mild positive correlation between the proportion of English and percentage of births to unmarried women in the United States with a correlation coefficient (R) of 0.343 and weighted average of 31.7%, a difference of 0.41%.
Births to Unmarried Women Correlation Summary
| Measurement | Kenyan | English |
| Minimum | 1.6% | 4.5% |
| Maximum | 100.0% | 100.0% |
| Range | 98.4% | 95.5% |
| Mean | 39.7% | 38.5% |
| Median | 32.7% | 32.8% |
| Interquartile 25% (IQ1) | 27.6% | 25.5% |
| Interquartile 75% (IQ3) | 46.9% | 40.7% |
| Interquartile Range (IQR) | 19.3% | 15.2% |
| Standard Deviation (Sample) | 24.0% | 24.5% |
| Standard Deviation (Population) | 23.7% | 24.3% |
Demographics Similar to Kenyans and English by Births to Unmarried Women
In terms of births to unmarried women, the demographic groups most similar to Kenyans are Canadian (31.9%, a difference of 0.16%), Immigrants from Peru (31.8%, a difference of 0.20%), Immigrants from South America (32.0%, a difference of 0.23%), Moroccan (31.8%, a difference of 0.26%), and German (32.0%, a difference of 0.34%). Similarly, the demographic groups most similar to English are South American Indian (31.7%, a difference of 0.030%), South American (31.8%, a difference of 0.040%), Scottish (31.7%, a difference of 0.070%), Moroccan (31.8%, a difference of 0.15%), and Immigrants from Venezuela (31.7%, a difference of 0.17%).
| Demographics | Rating | Rank | Births to Unmarried Women |
| Guamanians/Chamorros | 51.3 /100 | #170 | Average 31.6% |
| Finns | 50.5 /100 | #171 | Average 31.7% |
| Immigrants | Eritrea | 50.4 /100 | #172 | Average 31.7% |
| Immigrants | Yemen | 50.2 /100 | #173 | Average 31.7% |
| Venezuelans | 50.0 /100 | #174 | Average 31.7% |
| Immigrants | Venezuela | 49.2 /100 | #175 | Average 31.7% |
| Scottish | 48.1 /100 | #176 | Average 31.7% |
| South American Indians | 47.7 /100 | #177 | Average 31.7% |
| English | 47.4 /100 | #178 | Average 31.7% |
| South Americans | 46.9 /100 | #179 | Average 31.8% |
| Moroccans | 45.7 /100 | #180 | Average 31.8% |
| Immigrants | Peru | 45.1 /100 | #181 | Average 31.8% |
| Kenyans | 43.0 /100 | #182 | Average 31.9% |
| Canadians | 41.4 /100 | #183 | Average 31.9% |
| Immigrants | South America | 40.7 /100 | #184 | Average 32.0% |
| Germans | 39.5 /100 | #185 | Fair 32.0% |
| Welsh | 38.2 /100 | #186 | Fair 32.0% |
| Czechoslovakians | 38.0 /100 | #187 | Fair 32.0% |
| Osage | 37.1 /100 | #188 | Fair 32.1% |
| Immigrants | Kenya | 36.9 /100 | #189 | Fair 32.1% |
| Tlingit-Haida | 32.6 /100 | #190 | Fair 32.2% |