Jordanian vs Maltese Self-Care Disability
COMPARE
Jordanian
Maltese
Self-Care Disability
Self-Care Disability Comparison
Jordanians
Maltese
2.3%
SELF-CARE DISABILITY
99.7/ 100
METRIC RATING
47th/ 347
METRIC RANK
2.5%
SELF-CARE DISABILITY
37.5/ 100
METRIC RATING
182nd/ 347
METRIC RANK
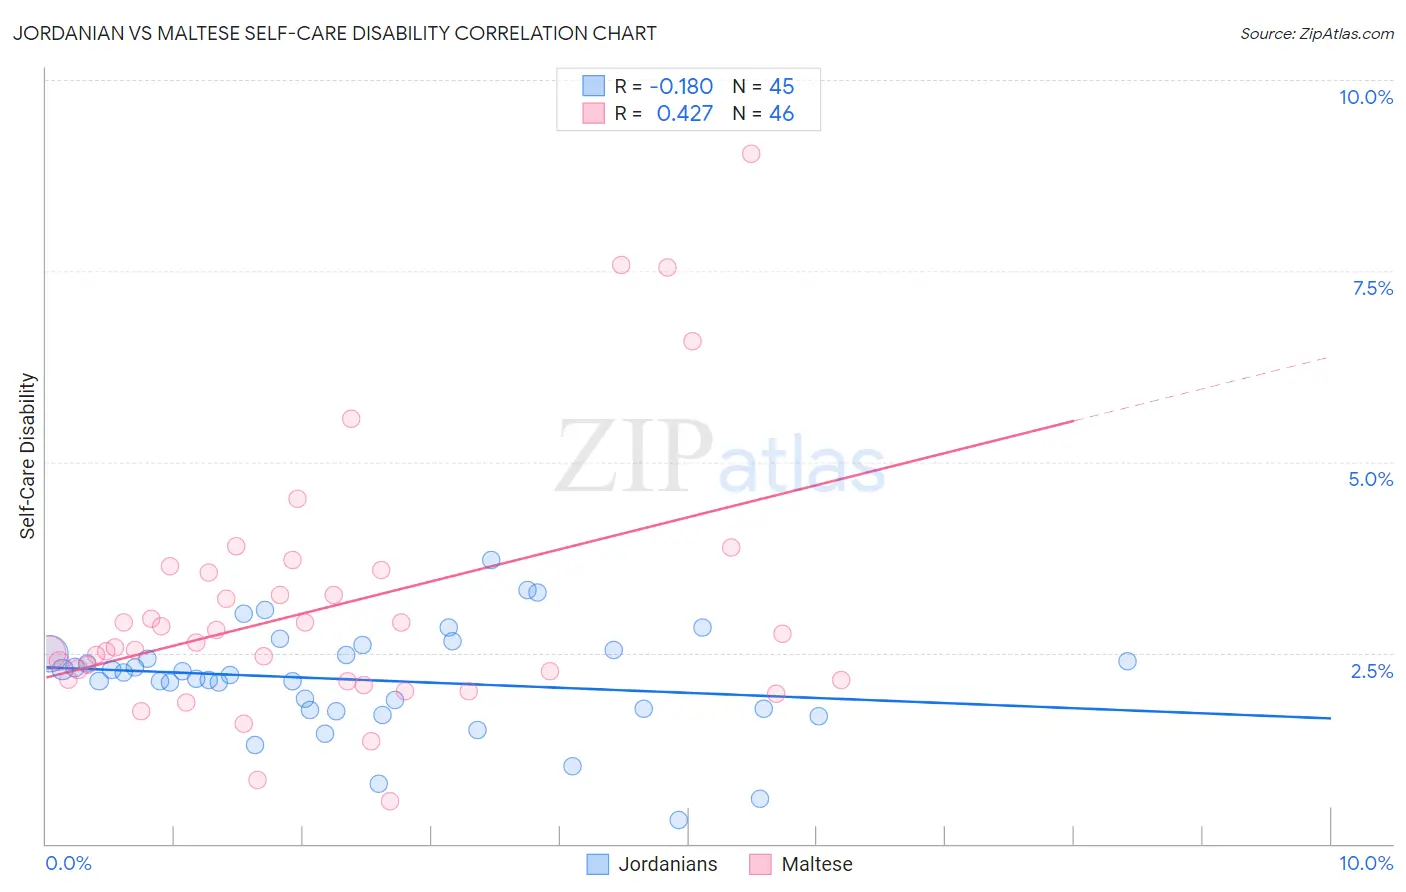
Jordanian vs Maltese Self-Care Disability Correlation Chart
The statistical analysis conducted on geographies consisting of 166,373,634 people shows a poor negative correlation between the proportion of Jordanians and percentage of population with self-care disability in the United States with a correlation coefficient (R) of -0.180 and weighted average of 2.3%. Similarly, the statistical analysis conducted on geographies consisting of 126,446,361 people shows a moderate positive correlation between the proportion of Maltese and percentage of population with self-care disability in the United States with a correlation coefficient (R) of 0.427 and weighted average of 2.5%, a difference of 8.3%.
Self-Care Disability Correlation Summary
| Measurement | Jordanian | Maltese |
| Minimum | 0.31% | 0.56% |
| Maximum | 3.7% | 9.0% |
| Range | 3.4% | 8.5% |
| Mean | 2.1% | 3.1% |
| Median | 2.2% | 2.6% |
| Interquartile 25% (IQ1) | 1.8% | 2.1% |
| Interquartile 75% (IQ3) | 2.5% | 3.5% |
| Interquartile Range (IQR) | 0.75% | 1.4% |
| Standard Deviation (Sample) | 0.69% | 1.7% |
| Standard Deviation (Population) | 0.68% | 1.7% |
Similar Demographics by Self-Care Disability
Demographics Similar to Jordanians by Self-Care Disability
In terms of self-care disability, the demographic groups most similar to Jordanians are Immigrants from Malaysia (2.3%, a difference of 0.040%), Latvian (2.3%, a difference of 0.22%), Czech (2.3%, a difference of 0.23%), Immigrants from Brazil (2.3%, a difference of 0.24%), and Norwegian (2.3%, a difference of 0.31%).
| Demographics | Rating | Rank | Self-Care Disability |
| Iranians | 99.8 /100 | #40 | Exceptional 2.3% |
| Immigrants | Sudan | 99.8 /100 | #41 | Exceptional 2.3% |
| Immigrants | Uganda | 99.8 /100 | #42 | Exceptional 2.3% |
| Immigrants | Pakistan | 99.8 /100 | #43 | Exceptional 2.3% |
| Immigrants | South Africa | 99.8 /100 | #44 | Exceptional 2.3% |
| Norwegians | 99.8 /100 | #45 | Exceptional 2.3% |
| Czechs | 99.8 /100 | #46 | Exceptional 2.3% |
| Jordanians | 99.7 /100 | #47 | Exceptional 2.3% |
| Immigrants | Malaysia | 99.7 /100 | #48 | Exceptional 2.3% |
| Latvians | 99.7 /100 | #49 | Exceptional 2.3% |
| Immigrants | Brazil | 99.7 /100 | #50 | Exceptional 2.3% |
| Kenyans | 99.7 /100 | #51 | Exceptional 2.3% |
| Immigrants | Serbia | 99.6 /100 | #52 | Exceptional 2.3% |
| Australians | 99.6 /100 | #53 | Exceptional 2.3% |
| Argentineans | 99.6 /100 | #54 | Exceptional 2.3% |
Demographics Similar to Maltese by Self-Care Disability
In terms of self-care disability, the demographic groups most similar to Maltese are Salvadoran (2.5%, a difference of 0.050%), Yugoslavian (2.5%, a difference of 0.070%), Ghanaian (2.5%, a difference of 0.14%), Slavic (2.5%, a difference of 0.16%), and Indonesian (2.5%, a difference of 0.19%).
| Demographics | Rating | Rank | Self-Care Disability |
| Immigrants | Bosnia and Herzegovina | 49.6 /100 | #175 | Average 2.5% |
| Immigrants | Afghanistan | 47.6 /100 | #176 | Average 2.5% |
| Immigrants | Kazakhstan | 46.7 /100 | #177 | Average 2.5% |
| English | 46.2 /100 | #178 | Average 2.5% |
| Hungarians | 45.5 /100 | #179 | Average 2.5% |
| Indonesians | 41.2 /100 | #180 | Average 2.5% |
| Ghanaians | 40.4 /100 | #181 | Average 2.5% |
| Maltese | 37.5 /100 | #182 | Fair 2.5% |
| Salvadorans | 36.4 /100 | #183 | Fair 2.5% |
| Yugoslavians | 36.1 /100 | #184 | Fair 2.5% |
| Slavs | 34.3 /100 | #185 | Fair 2.5% |
| Immigrants | El Salvador | 33.0 /100 | #186 | Fair 2.5% |
| Irish | 28.7 /100 | #187 | Fair 2.5% |
| Immigrants | Oceania | 28.3 /100 | #188 | Fair 2.5% |
| Immigrants | Eastern Europe | 28.0 /100 | #189 | Fair 2.5% |