Jordanian vs Celtic Self-Care Disability
COMPARE
Jordanian
Celtic
Self-Care Disability
Self-Care Disability Comparison
Jordanians
Celtics
2.3%
SELF-CARE DISABILITY
99.7/ 100
METRIC RATING
47th/ 347
METRIC RANK
2.6%
SELF-CARE DISABILITY
4.4/ 100
METRIC RATING
217th/ 347
METRIC RANK
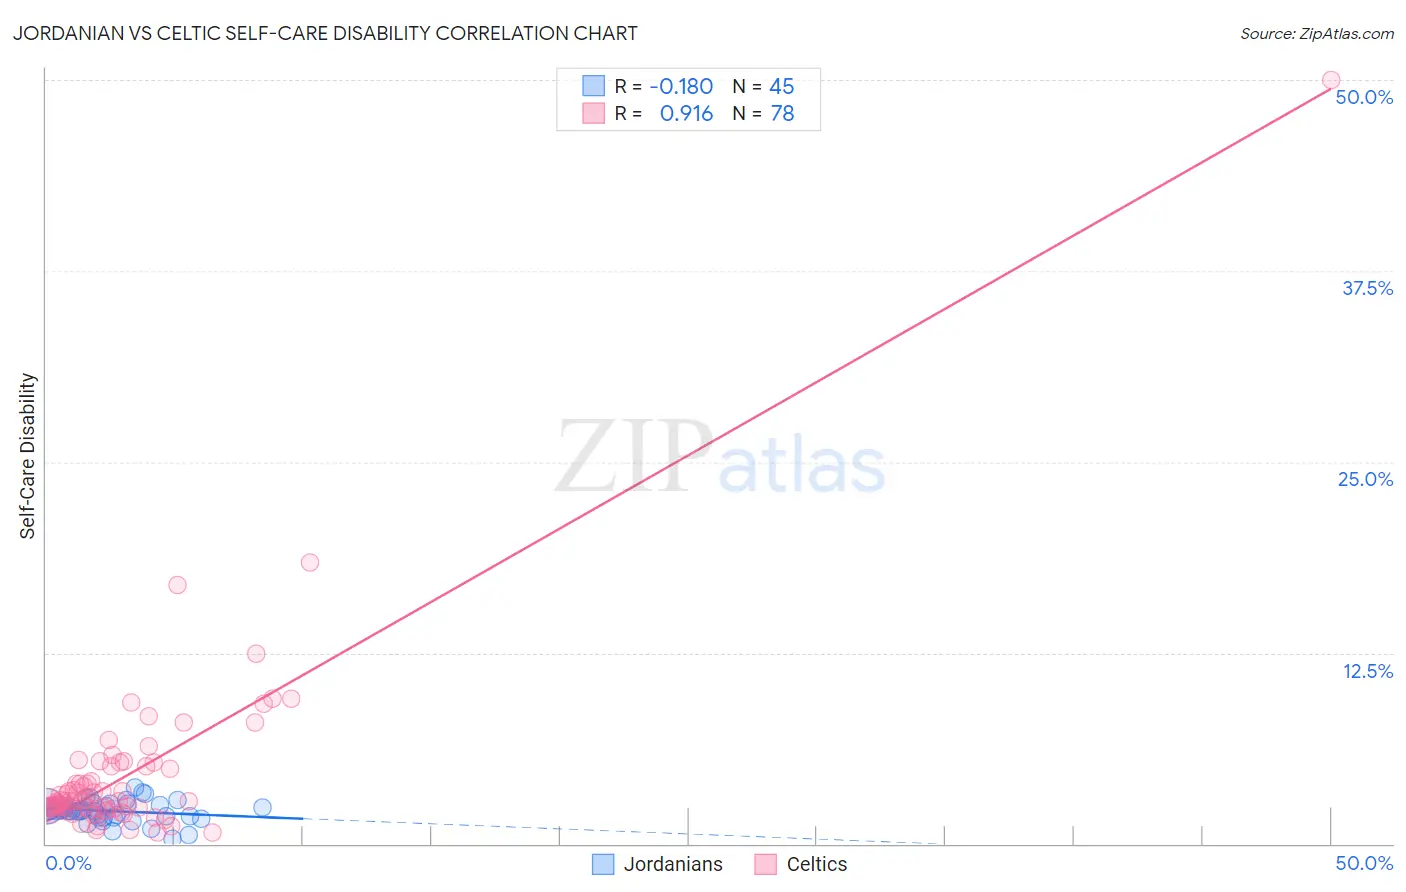
Jordanian vs Celtic Self-Care Disability Correlation Chart
The statistical analysis conducted on geographies consisting of 166,373,634 people shows a poor negative correlation between the proportion of Jordanians and percentage of population with self-care disability in the United States with a correlation coefficient (R) of -0.180 and weighted average of 2.3%. Similarly, the statistical analysis conducted on geographies consisting of 168,804,948 people shows a near-perfect positive correlation between the proportion of Celtics and percentage of population with self-care disability in the United States with a correlation coefficient (R) of 0.916 and weighted average of 2.6%, a difference of 11.6%.
Self-Care Disability Correlation Summary
| Measurement | Jordanian | Celtic |
| Minimum | 0.31% | 0.75% |
| Maximum | 3.7% | 50.0% |
| Range | 3.4% | 49.3% |
| Mean | 2.1% | 4.6% |
| Median | 2.2% | 2.8% |
| Interquartile 25% (IQ1) | 1.8% | 2.3% |
| Interquartile 75% (IQ3) | 2.5% | 5.1% |
| Interquartile Range (IQR) | 0.75% | 2.8% |
| Standard Deviation (Sample) | 0.69% | 6.1% |
| Standard Deviation (Population) | 0.68% | 6.1% |
Similar Demographics by Self-Care Disability
Demographics Similar to Jordanians by Self-Care Disability
In terms of self-care disability, the demographic groups most similar to Jordanians are Immigrants from Malaysia (2.3%, a difference of 0.040%), Latvian (2.3%, a difference of 0.22%), Czech (2.3%, a difference of 0.23%), Immigrants from Brazil (2.3%, a difference of 0.24%), and Norwegian (2.3%, a difference of 0.31%).
| Demographics | Rating | Rank | Self-Care Disability |
| Iranians | 99.8 /100 | #40 | Exceptional 2.3% |
| Immigrants | Sudan | 99.8 /100 | #41 | Exceptional 2.3% |
| Immigrants | Uganda | 99.8 /100 | #42 | Exceptional 2.3% |
| Immigrants | Pakistan | 99.8 /100 | #43 | Exceptional 2.3% |
| Immigrants | South Africa | 99.8 /100 | #44 | Exceptional 2.3% |
| Norwegians | 99.8 /100 | #45 | Exceptional 2.3% |
| Czechs | 99.8 /100 | #46 | Exceptional 2.3% |
| Jordanians | 99.7 /100 | #47 | Exceptional 2.3% |
| Immigrants | Malaysia | 99.7 /100 | #48 | Exceptional 2.3% |
| Latvians | 99.7 /100 | #49 | Exceptional 2.3% |
| Immigrants | Brazil | 99.7 /100 | #50 | Exceptional 2.3% |
| Kenyans | 99.7 /100 | #51 | Exceptional 2.3% |
| Immigrants | Serbia | 99.6 /100 | #52 | Exceptional 2.3% |
| Australians | 99.6 /100 | #53 | Exceptional 2.3% |
| Argentineans | 99.6 /100 | #54 | Exceptional 2.3% |
Demographics Similar to Celtics by Self-Care Disability
In terms of self-care disability, the demographic groups most similar to Celtics are White/Caucasian (2.6%, a difference of 0.020%), Immigrants from Thailand (2.6%, a difference of 0.040%), Scotch-Irish (2.6%, a difference of 0.070%), Ecuadorian (2.6%, a difference of 0.090%), and Immigrants from Honduras (2.6%, a difference of 0.090%).
| Demographics | Rating | Rank | Self-Care Disability |
| Panamanians | 6.4 /100 | #210 | Tragic 2.5% |
| Native Hawaiians | 5.1 /100 | #211 | Tragic 2.6% |
| Samoans | 5.1 /100 | #212 | Tragic 2.6% |
| Ecuadorians | 4.7 /100 | #213 | Tragic 2.6% |
| Immigrants | Honduras | 4.7 /100 | #214 | Tragic 2.6% |
| Immigrants | Thailand | 4.5 /100 | #215 | Tragic 2.6% |
| Whites/Caucasians | 4.4 /100 | #216 | Tragic 2.6% |
| Celtics | 4.4 /100 | #217 | Tragic 2.6% |
| Scotch-Irish | 4.1 /100 | #218 | Tragic 2.6% |
| Immigrants | Moldova | 4.0 /100 | #219 | Tragic 2.6% |
| Sub-Saharan Africans | 4.0 /100 | #220 | Tragic 2.6% |
| Hondurans | 3.8 /100 | #221 | Tragic 2.6% |
| Spaniards | 3.8 /100 | #222 | Tragic 2.6% |
| French Canadians | 3.8 /100 | #223 | Tragic 2.6% |
| Osage | 3.6 /100 | #224 | Tragic 2.6% |