Jordanian vs Immigrants from Sweden Self-Care Disability
COMPARE
Jordanian
Immigrants from Sweden
Self-Care Disability
Self-Care Disability Comparison
Jordanians
Immigrants from Sweden
2.3%
SELF-CARE DISABILITY
99.7/ 100
METRIC RATING
47th/ 347
METRIC RANK
2.3%
SELF-CARE DISABILITY
99.9/ 100
METRIC RATING
37th/ 347
METRIC RANK
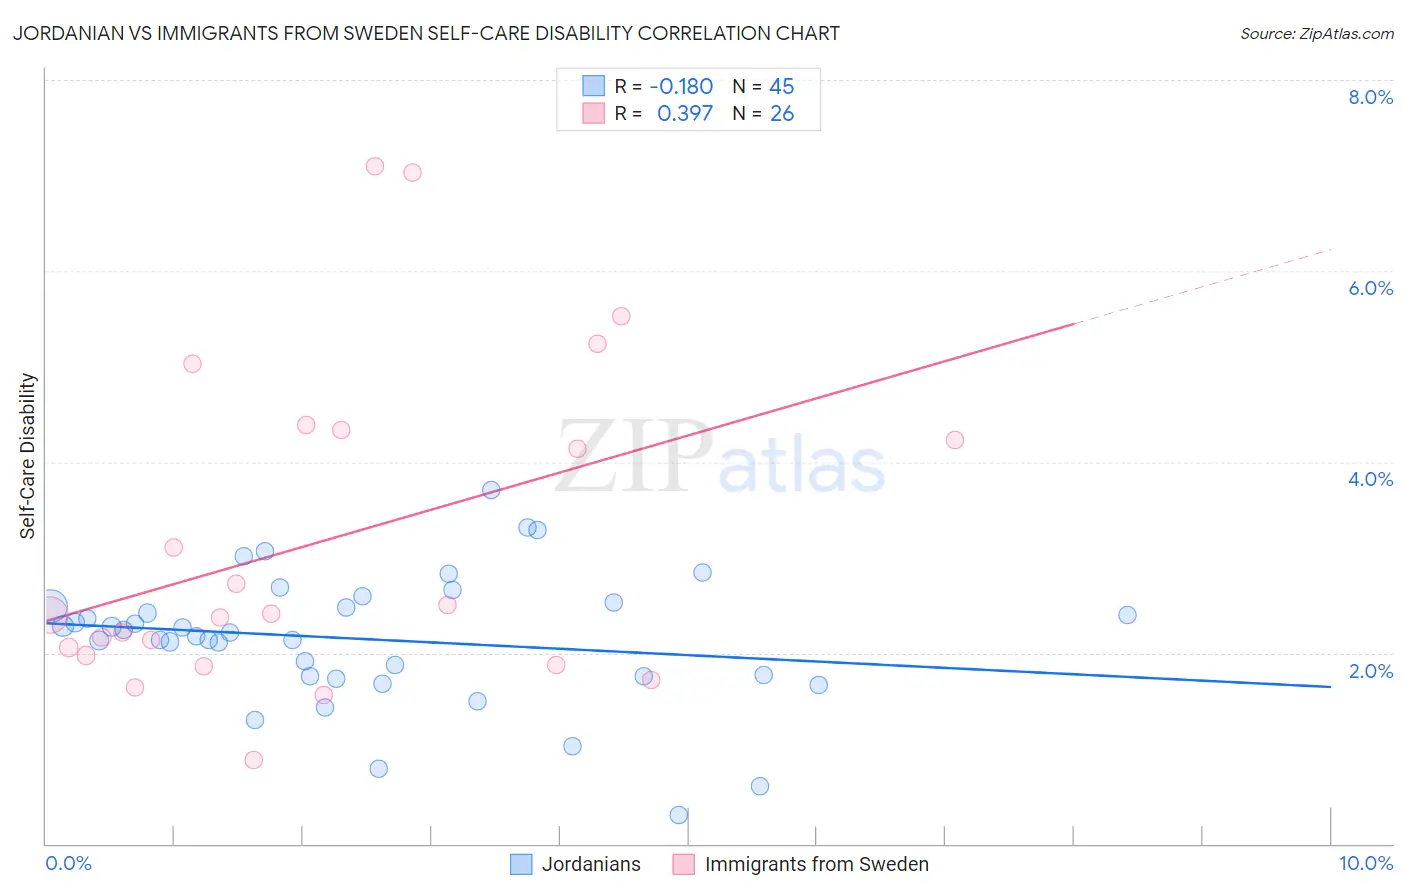
Jordanian vs Immigrants from Sweden Self-Care Disability Correlation Chart
The statistical analysis conducted on geographies consisting of 166,373,634 people shows a poor negative correlation between the proportion of Jordanians and percentage of population with self-care disability in the United States with a correlation coefficient (R) of -0.180 and weighted average of 2.3%. Similarly, the statistical analysis conducted on geographies consisting of 164,653,389 people shows a mild positive correlation between the proportion of Immigrants from Sweden and percentage of population with self-care disability in the United States with a correlation coefficient (R) of 0.397 and weighted average of 2.3%, a difference of 0.89%.
Self-Care Disability Correlation Summary
| Measurement | Jordanian | Immigrants from Sweden |
| Minimum | 0.31% | 0.87% |
| Maximum | 3.7% | 7.1% |
| Range | 3.4% | 6.2% |
| Mean | 2.1% | 3.2% |
| Median | 2.2% | 2.4% |
| Interquartile 25% (IQ1) | 1.8% | 2.0% |
| Interquartile 75% (IQ3) | 2.5% | 4.3% |
| Interquartile Range (IQR) | 0.75% | 2.4% |
| Standard Deviation (Sample) | 0.69% | 1.7% |
| Standard Deviation (Population) | 0.68% | 1.7% |
Demographics Similar to Jordanians and Immigrants from Sweden by Self-Care Disability
In terms of self-care disability, the demographic groups most similar to Jordanians are Immigrants from Malaysia (2.3%, a difference of 0.040%), Latvian (2.3%, a difference of 0.22%), Czech (2.3%, a difference of 0.23%), Immigrants from Brazil (2.3%, a difference of 0.24%), and Norwegian (2.3%, a difference of 0.31%). Similarly, the demographic groups most similar to Immigrants from Sweden are Immigrants from Eastern Africa (2.3%, a difference of 0.13%), Immigrants from Lithuania (2.3%, a difference of 0.17%), Immigrants from Australia (2.3%, a difference of 0.18%), Immigrants from Bulgaria (2.3%, a difference of 0.23%), and Immigrants from Turkey (2.3%, a difference of 0.24%).
| Demographics | Rating | Rank | Self-Care Disability |
| Burmese | 99.9 /100 | #32 | Exceptional 2.3% |
| Immigrants | Korea | 99.9 /100 | #33 | Exceptional 2.3% |
| Immigrants | Turkey | 99.9 /100 | #34 | Exceptional 2.3% |
| Immigrants | Australia | 99.9 /100 | #35 | Exceptional 2.3% |
| Immigrants | Lithuania | 99.9 /100 | #36 | Exceptional 2.3% |
| Immigrants | Sweden | 99.9 /100 | #37 | Exceptional 2.3% |
| Immigrants | Eastern Africa | 99.9 /100 | #38 | Exceptional 2.3% |
| Immigrants | Bulgaria | 99.8 /100 | #39 | Exceptional 2.3% |
| Iranians | 99.8 /100 | #40 | Exceptional 2.3% |
| Immigrants | Sudan | 99.8 /100 | #41 | Exceptional 2.3% |
| Immigrants | Uganda | 99.8 /100 | #42 | Exceptional 2.3% |
| Immigrants | Pakistan | 99.8 /100 | #43 | Exceptional 2.3% |
| Immigrants | South Africa | 99.8 /100 | #44 | Exceptional 2.3% |
| Norwegians | 99.8 /100 | #45 | Exceptional 2.3% |
| Czechs | 99.8 /100 | #46 | Exceptional 2.3% |
| Jordanians | 99.7 /100 | #47 | Exceptional 2.3% |
| Immigrants | Malaysia | 99.7 /100 | #48 | Exceptional 2.3% |
| Latvians | 99.7 /100 | #49 | Exceptional 2.3% |
| Immigrants | Brazil | 99.7 /100 | #50 | Exceptional 2.3% |
| Kenyans | 99.7 /100 | #51 | Exceptional 2.3% |
| Immigrants | Serbia | 99.6 /100 | #52 | Exceptional 2.3% |