Jordanian vs Bahamian Self-Care Disability
COMPARE
Jordanian
Bahamian
Self-Care Disability
Self-Care Disability Comparison
Jordanians
Bahamians
2.3%
SELF-CARE DISABILITY
99.7/ 100
METRIC RATING
47th/ 347
METRIC RANK
2.6%
SELF-CARE DISABILITY
2.0/ 100
METRIC RATING
235th/ 347
METRIC RANK
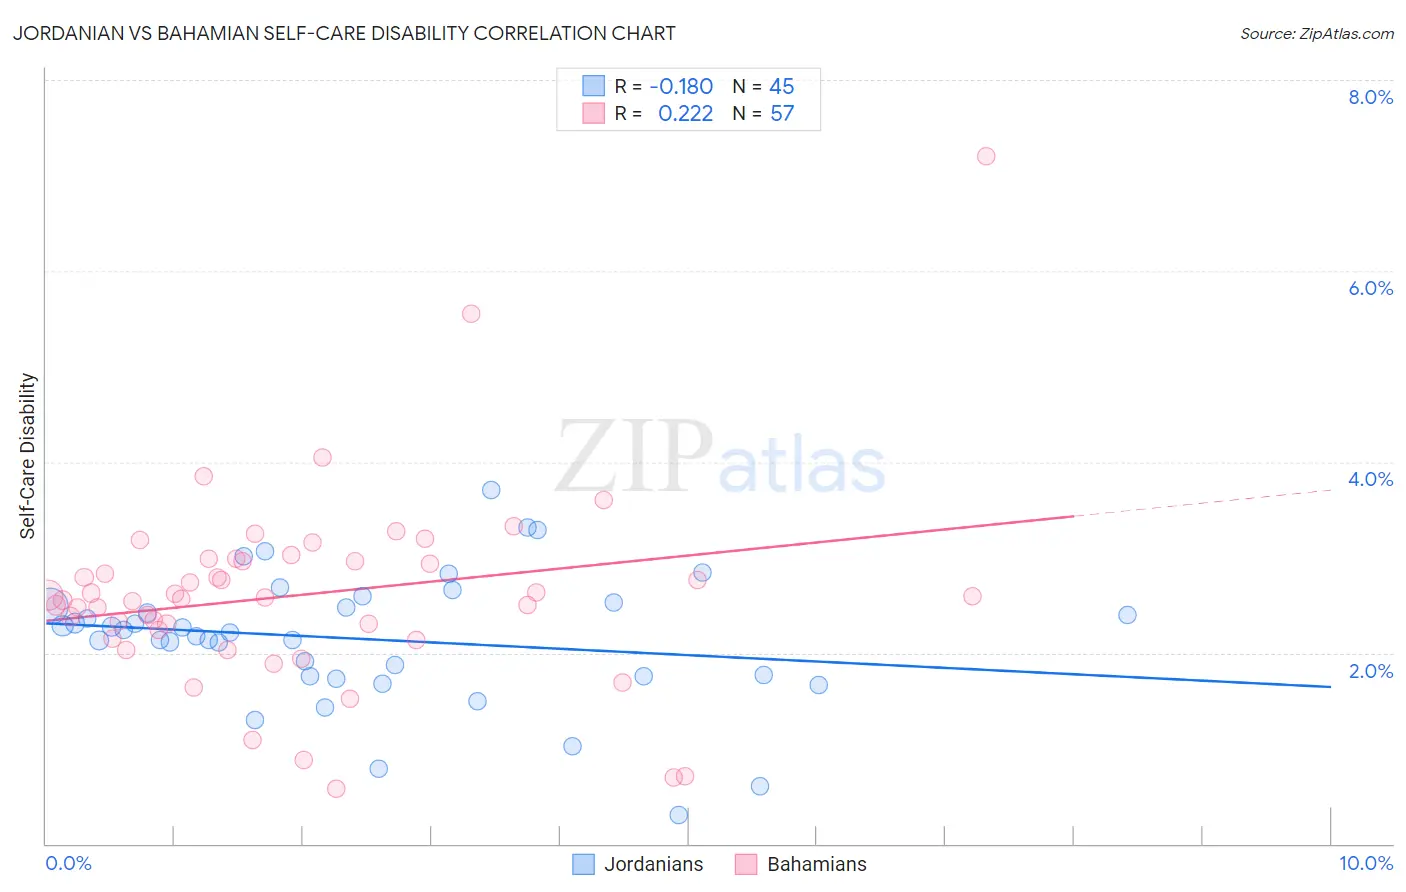
Jordanian vs Bahamian Self-Care Disability Correlation Chart
The statistical analysis conducted on geographies consisting of 166,373,634 people shows a poor negative correlation between the proportion of Jordanians and percentage of population with self-care disability in the United States with a correlation coefficient (R) of -0.180 and weighted average of 2.3%. Similarly, the statistical analysis conducted on geographies consisting of 112,612,333 people shows a weak positive correlation between the proportion of Bahamians and percentage of population with self-care disability in the United States with a correlation coefficient (R) of 0.222 and weighted average of 2.6%, a difference of 12.6%.
Self-Care Disability Correlation Summary
| Measurement | Jordanian | Bahamian |
| Minimum | 0.31% | 0.58% |
| Maximum | 3.7% | 7.2% |
| Range | 3.4% | 6.6% |
| Mean | 2.1% | 2.6% |
| Median | 2.2% | 2.6% |
| Interquartile 25% (IQ1) | 1.8% | 2.2% |
| Interquartile 75% (IQ3) | 2.5% | 3.0% |
| Interquartile Range (IQR) | 0.75% | 0.77% |
| Standard Deviation (Sample) | 0.69% | 1.0% |
| Standard Deviation (Population) | 0.68% | 1.0% |
Similar Demographics by Self-Care Disability
Demographics Similar to Jordanians by Self-Care Disability
In terms of self-care disability, the demographic groups most similar to Jordanians are Immigrants from Malaysia (2.3%, a difference of 0.040%), Latvian (2.3%, a difference of 0.22%), Czech (2.3%, a difference of 0.23%), Immigrants from Brazil (2.3%, a difference of 0.24%), and Norwegian (2.3%, a difference of 0.31%).
| Demographics | Rating | Rank | Self-Care Disability |
| Iranians | 99.8 /100 | #40 | Exceptional 2.3% |
| Immigrants | Sudan | 99.8 /100 | #41 | Exceptional 2.3% |
| Immigrants | Uganda | 99.8 /100 | #42 | Exceptional 2.3% |
| Immigrants | Pakistan | 99.8 /100 | #43 | Exceptional 2.3% |
| Immigrants | South Africa | 99.8 /100 | #44 | Exceptional 2.3% |
| Norwegians | 99.8 /100 | #45 | Exceptional 2.3% |
| Czechs | 99.8 /100 | #46 | Exceptional 2.3% |
| Jordanians | 99.7 /100 | #47 | Exceptional 2.3% |
| Immigrants | Malaysia | 99.7 /100 | #48 | Exceptional 2.3% |
| Latvians | 99.7 /100 | #49 | Exceptional 2.3% |
| Immigrants | Brazil | 99.7 /100 | #50 | Exceptional 2.3% |
| Kenyans | 99.7 /100 | #51 | Exceptional 2.3% |
| Immigrants | Serbia | 99.6 /100 | #52 | Exceptional 2.3% |
| Australians | 99.6 /100 | #53 | Exceptional 2.3% |
| Argentineans | 99.6 /100 | #54 | Exceptional 2.3% |
Demographics Similar to Bahamians by Self-Care Disability
In terms of self-care disability, the demographic groups most similar to Bahamians are Liberian (2.6%, a difference of 0.040%), Vietnamese (2.6%, a difference of 0.040%), Bermudan (2.6%, a difference of 0.070%), Albanian (2.6%, a difference of 0.090%), and Immigrants from Guatemala (2.6%, a difference of 0.11%).
| Demographics | Rating | Rank | Self-Care Disability |
| Guatemalans | 2.7 /100 | #228 | Tragic 2.6% |
| Guamanians/Chamorros | 2.5 /100 | #229 | Tragic 2.6% |
| Immigrants | Ecuador | 2.5 /100 | #230 | Tragic 2.6% |
| Immigrants | Guatemala | 2.2 /100 | #231 | Tragic 2.6% |
| Albanians | 2.2 /100 | #232 | Tragic 2.6% |
| Liberians | 2.1 /100 | #233 | Tragic 2.6% |
| Vietnamese | 2.1 /100 | #234 | Tragic 2.6% |
| Bahamians | 2.0 /100 | #235 | Tragic 2.6% |
| Bermudans | 1.9 /100 | #236 | Tragic 2.6% |
| Immigrants | Senegal | 1.6 /100 | #237 | Tragic 2.6% |
| Senegalese | 1.3 /100 | #238 | Tragic 2.6% |
| Immigrants | Panama | 1.2 /100 | #239 | Tragic 2.6% |
| Marshallese | 1.2 /100 | #240 | Tragic 2.6% |
| Immigrants | Syria | 1.0 /100 | #241 | Tragic 2.6% |
| Spanish | 0.8 /100 | #242 | Tragic 2.6% |