Immigrants from Ghana vs Celtic Self-Care Disability
COMPARE
Immigrants from Ghana
Celtic
Self-Care Disability
Self-Care Disability Comparison
Immigrants from Ghana
Celtics
2.5%
SELF-CARE DISABILITY
14.7/ 100
METRIC RATING
199th/ 347
METRIC RANK
2.6%
SELF-CARE DISABILITY
4.4/ 100
METRIC RATING
217th/ 347
METRIC RANK
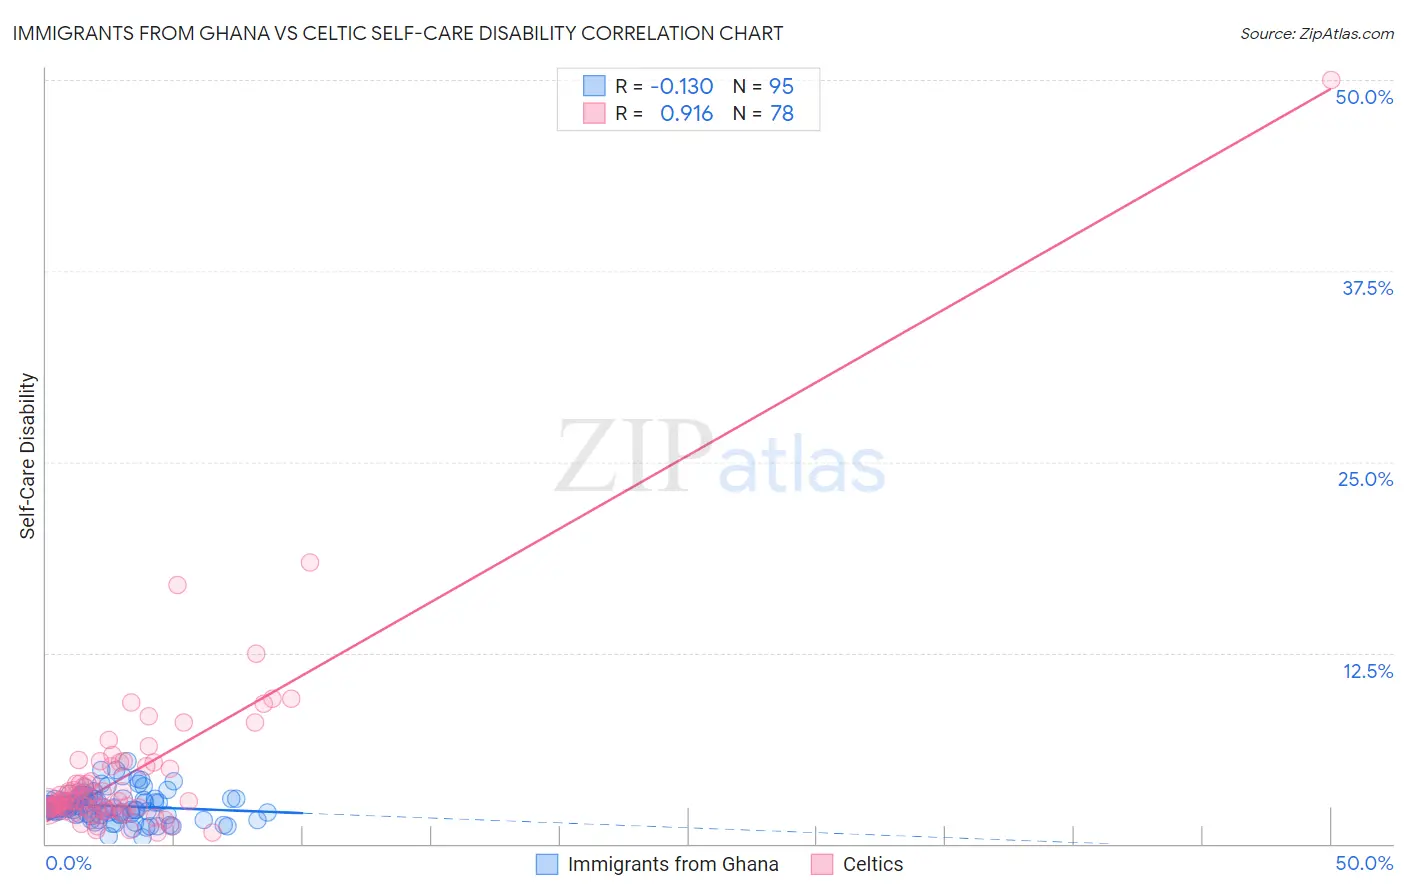
Immigrants from Ghana vs Celtic Self-Care Disability Correlation Chart
The statistical analysis conducted on geographies consisting of 199,790,257 people shows a poor negative correlation between the proportion of Immigrants from Ghana and percentage of population with self-care disability in the United States with a correlation coefficient (R) of -0.130 and weighted average of 2.5%. Similarly, the statistical analysis conducted on geographies consisting of 168,804,948 people shows a near-perfect positive correlation between the proportion of Celtics and percentage of population with self-care disability in the United States with a correlation coefficient (R) of 0.916 and weighted average of 2.6%, a difference of 1.5%.
Self-Care Disability Correlation Summary
| Measurement | Immigrants from Ghana | Celtic |
| Minimum | 0.40% | 0.75% |
| Maximum | 5.4% | 50.0% |
| Range | 5.0% | 49.3% |
| Mean | 2.5% | 4.6% |
| Median | 2.4% | 2.8% |
| Interquartile 25% (IQ1) | 2.0% | 2.3% |
| Interquartile 75% (IQ3) | 2.9% | 5.1% |
| Interquartile Range (IQR) | 0.96% | 2.8% |
| Standard Deviation (Sample) | 0.94% | 6.1% |
| Standard Deviation (Population) | 0.94% | 6.1% |
Demographics Similar to Immigrants from Ghana and Celtics by Self-Care Disability
In terms of self-care disability, the demographic groups most similar to Immigrants from Ghana are Immigrants (2.5%, a difference of 0.020%), Immigrants from Western Africa (2.5%, a difference of 0.14%), Immigrants from South Eastern Asia (2.5%, a difference of 0.18%), Slovak (2.5%, a difference of 0.21%), and Immigrants from Lebanon (2.5%, a difference of 0.23%). Similarly, the demographic groups most similar to Celtics are White/Caucasian (2.6%, a difference of 0.020%), Immigrants from Thailand (2.6%, a difference of 0.040%), Scotch-Irish (2.6%, a difference of 0.070%), Ecuadorian (2.6%, a difference of 0.090%), and Immigrants from Honduras (2.6%, a difference of 0.090%).
| Demographics | Rating | Rank | Self-Care Disability |
| Immigrants | Immigrants | 15.0 /100 | #198 | Poor 2.5% |
| Immigrants | Ghana | 14.7 /100 | #199 | Poor 2.5% |
| Immigrants | Western Africa | 13.3 /100 | #200 | Poor 2.5% |
| Immigrants | South Eastern Asia | 12.9 /100 | #201 | Poor 2.5% |
| Slovaks | 12.6 /100 | #202 | Poor 2.5% |
| Immigrants | Lebanon | 12.4 /100 | #203 | Poor 2.5% |
| Immigrants | Bahamas | 11.9 /100 | #204 | Poor 2.5% |
| Immigrants | Russia | 11.0 /100 | #205 | Poor 2.5% |
| Alaskan Athabascans | 10.4 /100 | #206 | Poor 2.5% |
| French | 9.9 /100 | #207 | Tragic 2.5% |
| Central Americans | 8.7 /100 | #208 | Tragic 2.5% |
| Malaysians | 7.7 /100 | #209 | Tragic 2.5% |
| Panamanians | 6.4 /100 | #210 | Tragic 2.5% |
| Native Hawaiians | 5.1 /100 | #211 | Tragic 2.6% |
| Samoans | 5.1 /100 | #212 | Tragic 2.6% |
| Ecuadorians | 4.7 /100 | #213 | Tragic 2.6% |
| Immigrants | Honduras | 4.7 /100 | #214 | Tragic 2.6% |
| Immigrants | Thailand | 4.5 /100 | #215 | Tragic 2.6% |
| Whites/Caucasians | 4.4 /100 | #216 | Tragic 2.6% |
| Celtics | 4.4 /100 | #217 | Tragic 2.6% |
| Scotch-Irish | 4.1 /100 | #218 | Tragic 2.6% |