Jamaican vs Tsimshian 9th Grade
COMPARE
Jamaican
Tsimshian
9th Grade
9th Grade Comparison
Jamaicans
Tsimshian
94.1%
9TH GRADE
1.0/ 100
METRIC RATING
251st/ 347
METRIC RANK
97.0%
9TH GRADE
100.0/ 100
METRIC RATING
1st/ 347
METRIC RANK
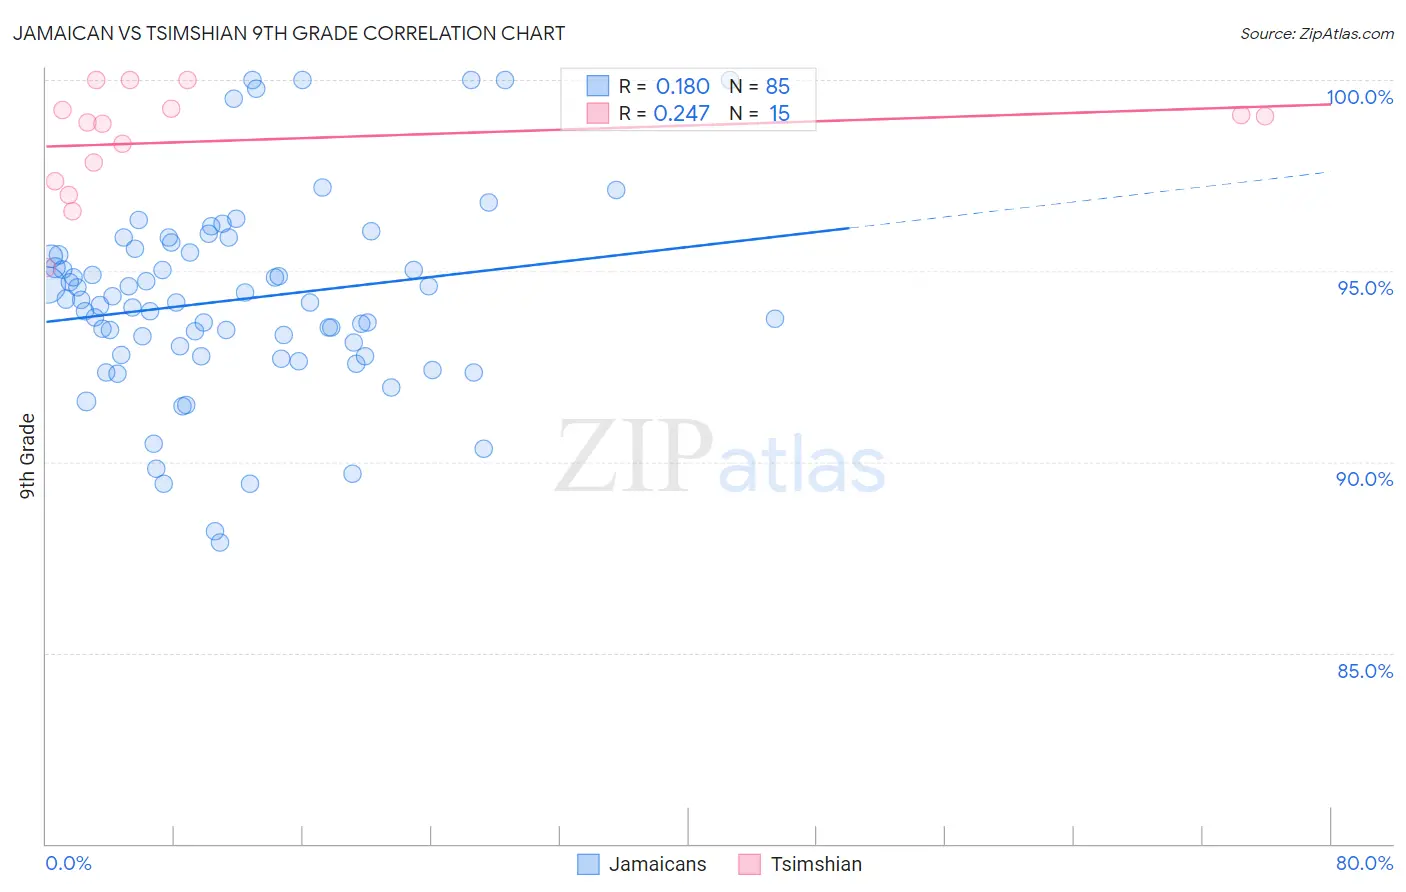
Jamaican vs Tsimshian 9th Grade Correlation Chart
The statistical analysis conducted on geographies consisting of 368,084,732 people shows a poor positive correlation between the proportion of Jamaicans and percentage of population with at least 9th grade education in the United States with a correlation coefficient (R) of 0.180 and weighted average of 94.1%. Similarly, the statistical analysis conducted on geographies consisting of 15,626,544 people shows a weak positive correlation between the proportion of Tsimshian and percentage of population with at least 9th grade education in the United States with a correlation coefficient (R) of 0.247 and weighted average of 97.0%, a difference of 3.1%.
9th Grade Correlation Summary
| Measurement | Jamaican | Tsimshian |
| Minimum | 87.9% | 95.1% |
| Maximum | 100.0% | 100.0% |
| Range | 12.1% | 4.9% |
| Mean | 94.2% | 98.4% |
| Median | 94.2% | 98.9% |
| Interquartile 25% (IQ1) | 92.8% | 97.4% |
| Interquartile 75% (IQ3) | 95.5% | 99.2% |
| Interquartile Range (IQR) | 2.8% | 1.9% |
| Standard Deviation (Sample) | 2.6% | 1.4% |
| Standard Deviation (Population) | 2.5% | 1.4% |
Similar Demographics by 9th Grade
Demographics Similar to Jamaicans by 9th Grade
In terms of 9th grade, the demographic groups most similar to Jamaicans are Immigrants from Senegal (94.1%, a difference of 0.010%), Colombian (94.0%, a difference of 0.030%), Uruguayan (94.1%, a difference of 0.060%), Immigrants from Hong Kong (94.1%, a difference of 0.060%), and U.S. Virgin Islander (94.0%, a difference of 0.060%).
| Demographics | Rating | Rank | 9th Grade |
| Dutch West Indians | 2.0 /100 | #244 | Tragic 94.2% |
| Paiute | 1.9 /100 | #245 | Tragic 94.2% |
| Senegalese | 1.9 /100 | #246 | Tragic 94.2% |
| Afghans | 1.8 /100 | #247 | Tragic 94.2% |
| Immigrants | Somalia | 1.4 /100 | #248 | Tragic 94.1% |
| Uruguayans | 1.3 /100 | #249 | Tragic 94.1% |
| Immigrants | Hong Kong | 1.3 /100 | #250 | Tragic 94.1% |
| Jamaicans | 1.0 /100 | #251 | Tragic 94.1% |
| Immigrants | Senegal | 0.9 /100 | #252 | Tragic 94.1% |
| Colombians | 0.8 /100 | #253 | Tragic 94.0% |
| U.S. Virgin Islanders | 0.7 /100 | #254 | Tragic 94.0% |
| Immigrants | Nigeria | 0.6 /100 | #255 | Tragic 94.0% |
| Immigrants | Afghanistan | 0.5 /100 | #256 | Tragic 94.0% |
| Immigrants | Costa Rica | 0.5 /100 | #257 | Tragic 94.0% |
| Immigrants | Thailand | 0.5 /100 | #258 | Tragic 93.9% |
Demographics Similar to Tsimshian by 9th Grade
In terms of 9th grade, the demographic groups most similar to Tsimshian are Norwegian (96.9%, a difference of 0.090%), Slovak (96.9%, a difference of 0.14%), Slovene (96.7%, a difference of 0.27%), Swedish (96.7%, a difference of 0.28%), and Polish (96.7%, a difference of 0.29%).
| Demographics | Rating | Rank | 9th Grade |
| Tsimshian | 100.0 /100 | #1 | Exceptional 97.0% |
| Norwegians | 100.0 /100 | #2 | Exceptional 96.9% |
| Slovaks | 100.0 /100 | #3 | Exceptional 96.9% |
| Slovenes | 100.0 /100 | #4 | Exceptional 96.7% |
| Swedes | 100.0 /100 | #5 | Exceptional 96.7% |
| Poles | 100.0 /100 | #6 | Exceptional 96.7% |
| Carpatho Rusyns | 100.0 /100 | #7 | Exceptional 96.7% |
| Germans | 100.0 /100 | #8 | Exceptional 96.7% |
| Tlingit-Haida | 100.0 /100 | #9 | Exceptional 96.6% |
| Lithuanians | 100.0 /100 | #10 | Exceptional 96.6% |
| Finns | 100.0 /100 | #11 | Exceptional 96.6% |
| English | 100.0 /100 | #12 | Exceptional 96.6% |
| Danes | 100.0 /100 | #13 | Exceptional 96.5% |
| Scottish | 100.0 /100 | #14 | Exceptional 96.5% |
| Irish | 100.0 /100 | #15 | Exceptional 96.5% |