Jamaican vs Colombian Ambulatory Disability
COMPARE
Jamaican
Colombian
Ambulatory Disability
Ambulatory Disability Comparison
Jamaicans
Colombians
6.7%
AMBULATORY DISABILITY
0.1/ 100
METRIC RATING
277th/ 347
METRIC RANK
5.8%
AMBULATORY DISABILITY
97.2/ 100
METRIC RATING
108th/ 347
METRIC RANK
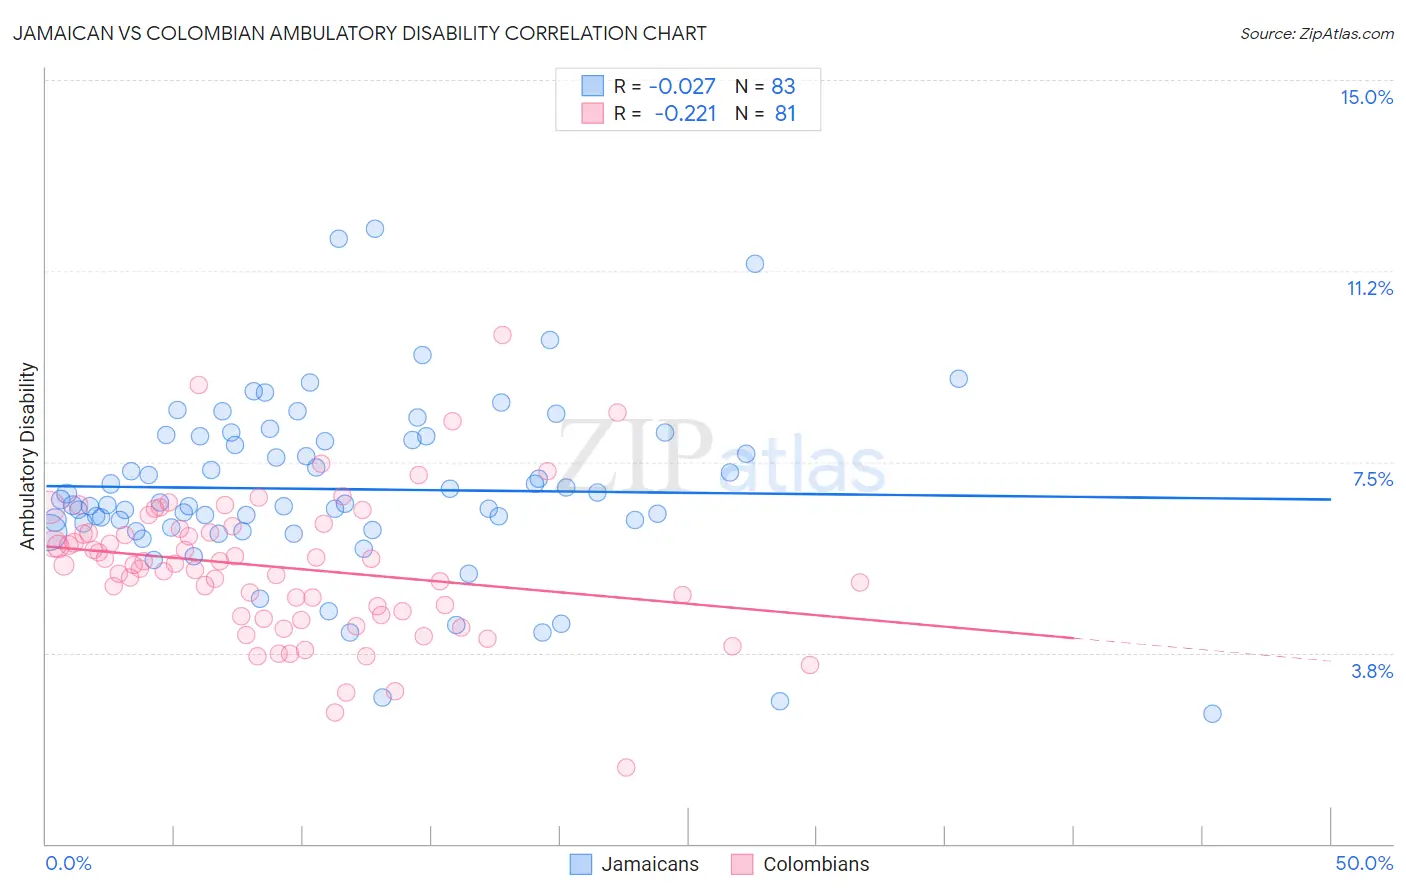
Jamaican vs Colombian Ambulatory Disability Correlation Chart
The statistical analysis conducted on geographies consisting of 367,821,612 people shows no correlation between the proportion of Jamaicans and percentage of population with ambulatory disability in the United States with a correlation coefficient (R) of -0.027 and weighted average of 6.7%. Similarly, the statistical analysis conducted on geographies consisting of 419,485,288 people shows a weak negative correlation between the proportion of Colombians and percentage of population with ambulatory disability in the United States with a correlation coefficient (R) of -0.221 and weighted average of 5.8%, a difference of 15.2%.
Ambulatory Disability Correlation Summary
| Measurement | Jamaican | Colombian |
| Minimum | 2.5% | 1.5% |
| Maximum | 12.1% | 10.0% |
| Range | 9.5% | 8.5% |
| Mean | 7.0% | 5.4% |
| Median | 6.7% | 5.5% |
| Interquartile 25% (IQ1) | 6.2% | 4.5% |
| Interquartile 75% (IQ3) | 8.0% | 6.2% |
| Interquartile Range (IQR) | 1.8% | 1.7% |
| Standard Deviation (Sample) | 1.7% | 1.4% |
| Standard Deviation (Population) | 1.7% | 1.4% |
Similar Demographics by Ambulatory Disability
Demographics Similar to Jamaicans by Ambulatory Disability
In terms of ambulatory disability, the demographic groups most similar to Jamaicans are Celtic (6.7%, a difference of 0.080%), Immigrants from West Indies (6.7%, a difference of 0.080%), Immigrants from Guyana (6.7%, a difference of 0.11%), Sioux (6.7%, a difference of 0.17%), and Immigrants from Caribbean (6.7%, a difference of 0.39%).
| Demographics | Rating | Rank | Ambulatory Disability |
| Slovaks | 0.1 /100 | #270 | Tragic 6.7% |
| Immigrants | Trinidad and Tobago | 0.1 /100 | #271 | Tragic 6.7% |
| French Canadians | 0.1 /100 | #272 | Tragic 6.7% |
| Whites/Caucasians | 0.1 /100 | #273 | Tragic 6.7% |
| Sioux | 0.1 /100 | #274 | Tragic 6.7% |
| Immigrants | Guyana | 0.1 /100 | #275 | Tragic 6.7% |
| Celtics | 0.1 /100 | #276 | Tragic 6.7% |
| Jamaicans | 0.1 /100 | #277 | Tragic 6.7% |
| Immigrants | West Indies | 0.1 /100 | #278 | Tragic 6.7% |
| Immigrants | Caribbean | 0.0 /100 | #279 | Tragic 6.7% |
| Pennsylvania Germans | 0.0 /100 | #280 | Tragic 6.8% |
| Yaqui | 0.0 /100 | #281 | Tragic 6.8% |
| Barbadians | 0.0 /100 | #282 | Tragic 6.8% |
| Immigrants | Barbados | 0.0 /100 | #283 | Tragic 6.8% |
| Immigrants | Jamaica | 0.0 /100 | #284 | Tragic 6.8% |
Demographics Similar to Colombians by Ambulatory Disability
In terms of ambulatory disability, the demographic groups most similar to Colombians are Uruguayan (5.8%, a difference of 0.010%), Immigrants from Netherlands (5.8%, a difference of 0.020%), Immigrants from Morocco (5.8%, a difference of 0.070%), Immigrants from Czechoslovakia (5.8%, a difference of 0.14%), and Immigrants from Colombia (5.8%, a difference of 0.19%).
| Demographics | Rating | Rank | Ambulatory Disability |
| Immigrants | South America | 97.9 /100 | #101 | Exceptional 5.8% |
| Immigrants | Kenya | 97.8 /100 | #102 | Exceptional 5.8% |
| Immigrants | Romania | 97.7 /100 | #103 | Exceptional 5.8% |
| New Zealanders | 97.6 /100 | #104 | Exceptional 5.8% |
| Immigrants | Czechoslovakia | 97.4 /100 | #105 | Exceptional 5.8% |
| Immigrants | Morocco | 97.3 /100 | #106 | Exceptional 5.8% |
| Uruguayans | 97.2 /100 | #107 | Exceptional 5.8% |
| Colombians | 97.2 /100 | #108 | Exceptional 5.8% |
| Immigrants | Netherlands | 97.1 /100 | #109 | Exceptional 5.8% |
| Immigrants | Colombia | 96.7 /100 | #110 | Exceptional 5.8% |
| Danes | 96.6 /100 | #111 | Exceptional 5.8% |
| South Africans | 96.3 /100 | #112 | Exceptional 5.9% |
| Immigrants | Uruguay | 95.6 /100 | #113 | Exceptional 5.9% |
| Immigrants | Poland | 95.4 /100 | #114 | Exceptional 5.9% |
| South American Indians | 94.8 /100 | #115 | Exceptional 5.9% |