Israeli vs New Zealander Householder Income Ages 25 - 44 years
COMPARE
Israeli
New Zealander
Householder Income Ages 25 - 44 years
Householder Income Ages 25 - 44 years Comparison
Israelis
New Zealanders
$107,579
HOUSEHOLDER INCOME AGES 25 - 44 YEARS
99.9/ 100
METRIC RATING
45th/ 347
METRIC RANK
$105,085
HOUSEHOLDER INCOME AGES 25 - 44 YEARS
99.7/ 100
METRIC RATING
64th/ 347
METRIC RANK
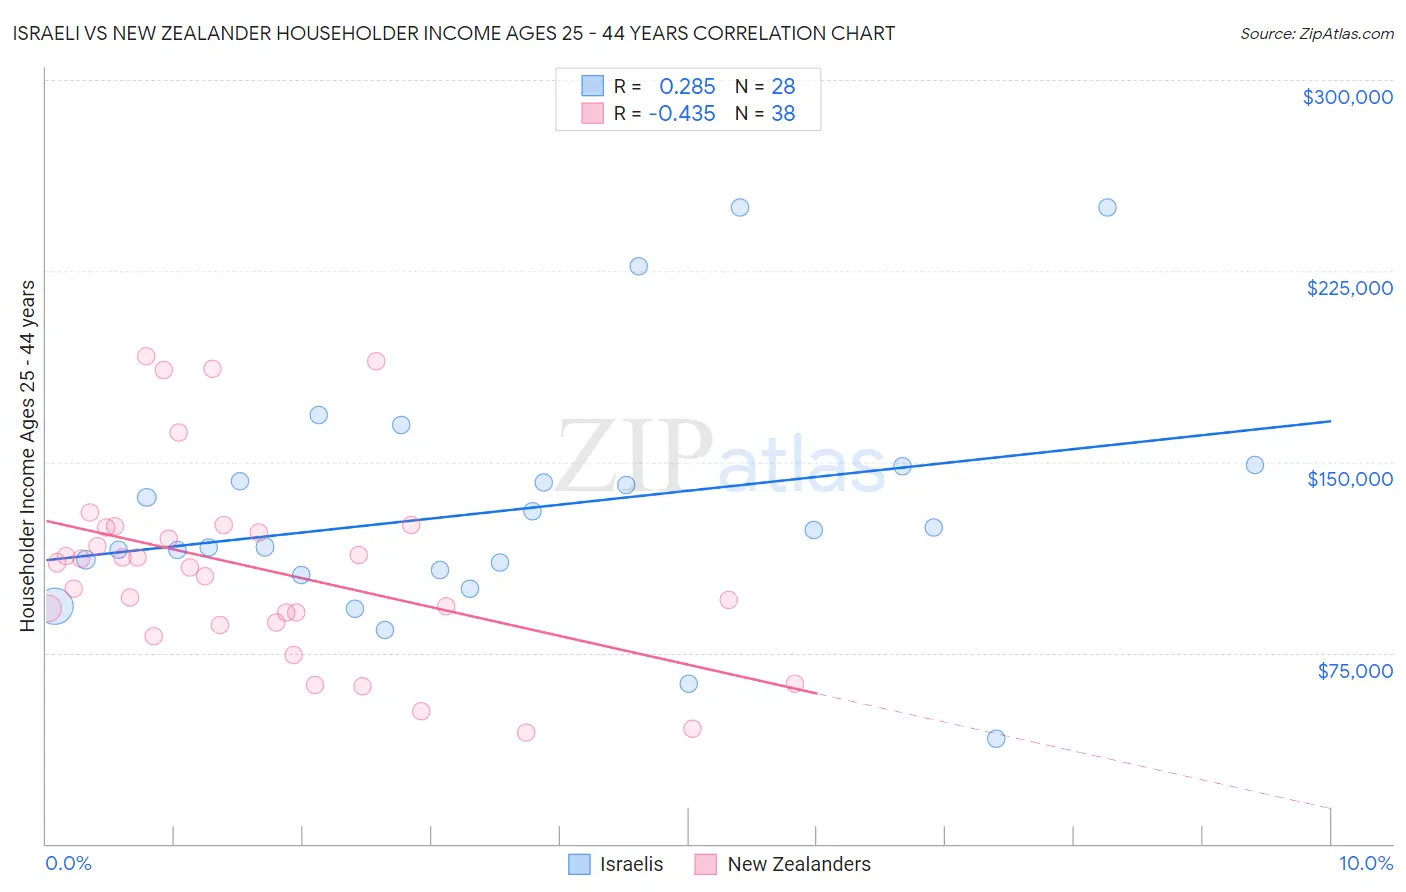
Israeli vs New Zealander Householder Income Ages 25 - 44 years Correlation Chart
The statistical analysis conducted on geographies consisting of 210,632,541 people shows a weak positive correlation between the proportion of Israelis and household income with householder between the ages 25 and 44 in the United States with a correlation coefficient (R) of 0.285 and weighted average of $107,579. Similarly, the statistical analysis conducted on geographies consisting of 106,878,711 people shows a moderate negative correlation between the proportion of New Zealanders and household income with householder between the ages 25 and 44 in the United States with a correlation coefficient (R) of -0.435 and weighted average of $105,085, a difference of 2.4%.
Householder Income Ages 25 - 44 years Correlation Summary
| Measurement | Israeli | New Zealander |
| Minimum | $41,080 | $43,917 |
| Maximum | $250,001 | $191,624 |
| Range | $208,921 | $147,707 |
| Mean | $131,021 | $108,113 |
| Median | $119,912 | $109,281 |
| Interquartile 25% (IQ1) | $106,515 | $87,015 |
| Interquartile 75% (IQ3) | $145,332 | $124,339 |
| Interquartile Range (IQR) | $38,818 | $37,324 |
| Standard Deviation (Sample) | $48,252 | $37,737 |
| Standard Deviation (Population) | $47,383 | $37,238 |
Demographics Similar to Israelis and New Zealanders by Householder Income Ages 25 - 44 years
In terms of householder income ages 25 - 44 years, the demographic groups most similar to Israelis are Immigrants from Indonesia ($107,627, a difference of 0.040%), Immigrants from Belarus ($107,393, a difference of 0.17%), Estonian ($107,269, a difference of 0.29%), Bulgarian ($107,264, a difference of 0.29%), and Immigrants from Turkey ($107,258, a difference of 0.30%). Similarly, the demographic groups most similar to New Zealanders are Immigrants from Scotland ($105,089, a difference of 0.0%), Immigrants from Italy ($105,201, a difference of 0.11%), Lithuanian ($105,223, a difference of 0.13%), Egyptian ($105,282, a difference of 0.19%), and Immigrants from Latvia ($105,522, a difference of 0.42%).
| Demographics | Rating | Rank | Householder Income Ages 25 - 44 years |
| Immigrants | Indonesia | 99.9 /100 | #44 | Exceptional $107,627 |
| Israelis | 99.9 /100 | #45 | Exceptional $107,579 |
| Immigrants | Belarus | 99.9 /100 | #46 | Exceptional $107,393 |
| Estonians | 99.9 /100 | #47 | Exceptional $107,269 |
| Bulgarians | 99.9 /100 | #48 | Exceptional $107,264 |
| Immigrants | Turkey | 99.9 /100 | #49 | Exceptional $107,258 |
| Cambodians | 99.9 /100 | #50 | Exceptional $107,148 |
| Immigrants | Czechoslovakia | 99.9 /100 | #51 | Exceptional $106,888 |
| Immigrants | Europe | 99.9 /100 | #52 | Exceptional $106,817 |
| Immigrants | Norway | 99.9 /100 | #53 | Exceptional $106,629 |
| Paraguayans | 99.9 /100 | #54 | Exceptional $106,615 |
| Greeks | 99.9 /100 | #55 | Exceptional $106,457 |
| Immigrants | Pakistan | 99.8 /100 | #56 | Exceptional $106,129 |
| Immigrants | Austria | 99.8 /100 | #57 | Exceptional $106,103 |
| Immigrants | South Africa | 99.8 /100 | #58 | Exceptional $105,748 |
| Immigrants | Latvia | 99.8 /100 | #59 | Exceptional $105,522 |
| Egyptians | 99.7 /100 | #60 | Exceptional $105,282 |
| Lithuanians | 99.7 /100 | #61 | Exceptional $105,223 |
| Immigrants | Italy | 99.7 /100 | #62 | Exceptional $105,201 |
| Immigrants | Scotland | 99.7 /100 | #63 | Exceptional $105,089 |
| New Zealanders | 99.7 /100 | #64 | Exceptional $105,085 |