Iroquois vs Immigrants from Norway Cognitive Disability
COMPARE
Iroquois
Immigrants from Norway
Cognitive Disability
Cognitive Disability Comparison
Iroquois
Immigrants from Norway
18.2%
COGNITIVE DISABILITY
0.1/ 100
METRIC RATING
292nd/ 347
METRIC RANK
17.0%
COGNITIVE DISABILITY
90.9/ 100
METRIC RATING
137th/ 347
METRIC RANK
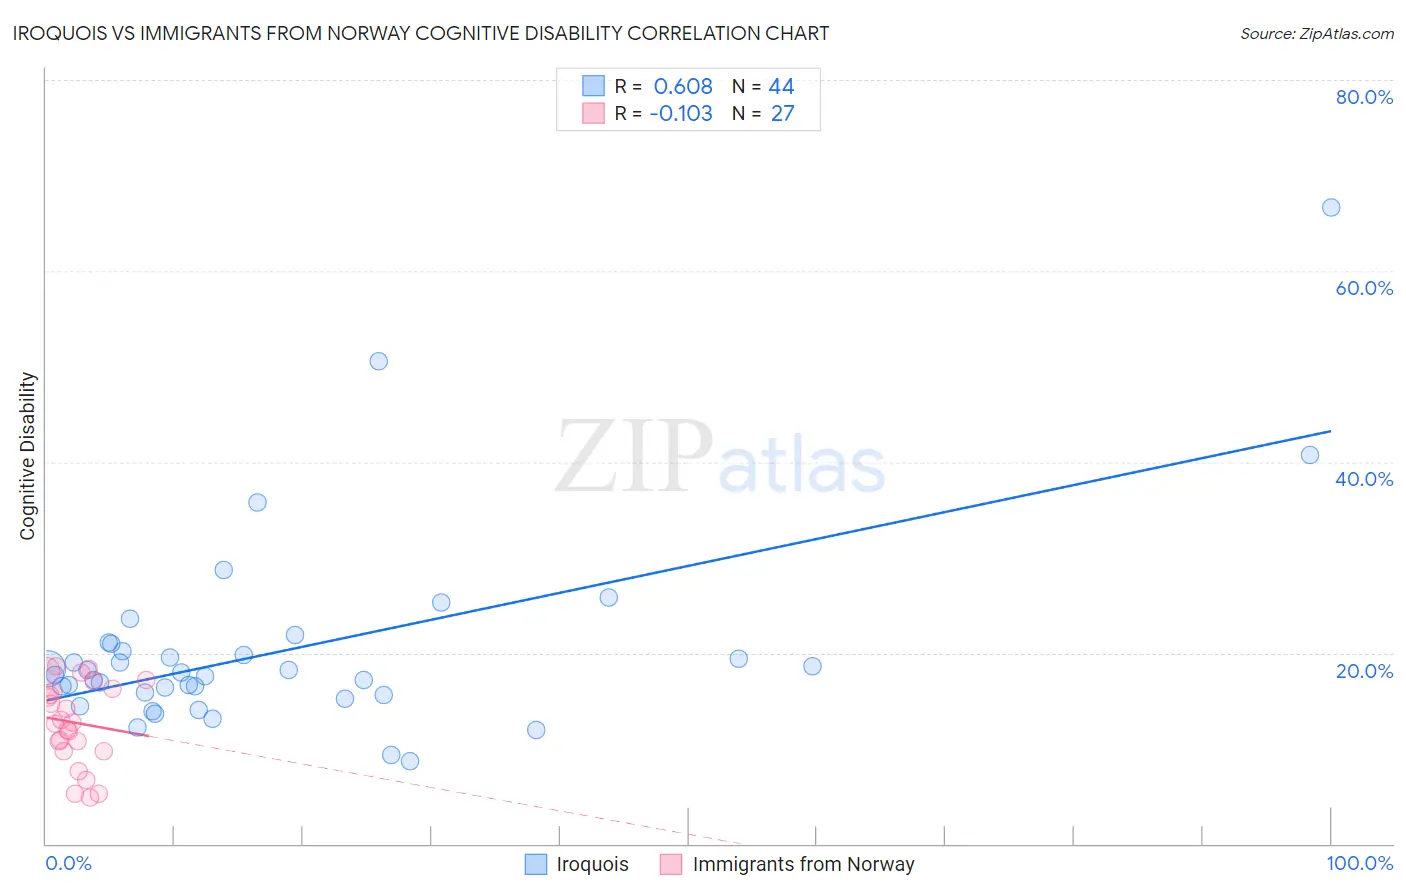
Iroquois vs Immigrants from Norway Cognitive Disability Correlation Chart
The statistical analysis conducted on geographies consisting of 207,276,810 people shows a significant positive correlation between the proportion of Iroquois and percentage of population with cognitive disability in the United States with a correlation coefficient (R) of 0.608 and weighted average of 18.2%. Similarly, the statistical analysis conducted on geographies consisting of 116,706,385 people shows a poor negative correlation between the proportion of Immigrants from Norway and percentage of population with cognitive disability in the United States with a correlation coefficient (R) of -0.103 and weighted average of 17.0%, a difference of 7.0%.
Cognitive Disability Correlation Summary
| Measurement | Iroquois | Immigrants from Norway |
| Minimum | 8.7% | 4.9% |
| Maximum | 66.7% | 18.5% |
| Range | 58.0% | 13.7% |
| Mean | 20.3% | 12.7% |
| Median | 17.8% | 12.7% |
| Interquartile 25% (IQ1) | 15.7% | 9.7% |
| Interquartile 75% (IQ3) | 20.6% | 16.2% |
| Interquartile Range (IQR) | 4.8% | 6.5% |
| Standard Deviation (Sample) | 10.4% | 4.2% |
| Standard Deviation (Population) | 10.3% | 4.2% |
Similar Demographics by Cognitive Disability
Demographics Similar to Iroquois by Cognitive Disability
In terms of cognitive disability, the demographic groups most similar to Iroquois are Central American Indian (18.2%, a difference of 0.010%), Ottawa (18.2%, a difference of 0.070%), British West Indian (18.2%, a difference of 0.080%), Immigrants from Africa (18.1%, a difference of 0.20%), and Native/Alaskan (18.1%, a difference of 0.23%).
| Demographics | Rating | Rank | Cognitive Disability |
| Bermudans | 0.1 /100 | #285 | Tragic 18.1% |
| Kenyans | 0.1 /100 | #286 | Tragic 18.1% |
| Dutch West Indians | 0.1 /100 | #287 | Tragic 18.1% |
| Immigrants | West Indies | 0.1 /100 | #288 | Tragic 18.1% |
| Natives/Alaskans | 0.1 /100 | #289 | Tragic 18.1% |
| Immigrants | Africa | 0.1 /100 | #290 | Tragic 18.1% |
| Ottawa | 0.1 /100 | #291 | Tragic 18.2% |
| Iroquois | 0.1 /100 | #292 | Tragic 18.2% |
| Central American Indians | 0.1 /100 | #293 | Tragic 18.2% |
| British West Indians | 0.1 /100 | #294 | Tragic 18.2% |
| German Russians | 0.0 /100 | #295 | Tragic 18.2% |
| Immigrants | Burma/Myanmar | 0.0 /100 | #296 | Tragic 18.2% |
| Blackfeet | 0.0 /100 | #297 | Tragic 18.3% |
| Japanese | 0.0 /100 | #298 | Tragic 18.3% |
| Ghanaians | 0.0 /100 | #299 | Tragic 18.3% |
Demographics Similar to Immigrants from Norway by Cognitive Disability
In terms of cognitive disability, the demographic groups most similar to Immigrants from Norway are Israeli (17.0%, a difference of 0.0%), Welsh (17.0%, a difference of 0.020%), Lebanese (17.0%, a difference of 0.030%), Immigrants from Chile (17.0%, a difference of 0.070%), and French (17.0%, a difference of 0.080%).
| Demographics | Rating | Rank | Cognitive Disability |
| Immigrants | Vietnam | 92.4 /100 | #130 | Exceptional 17.0% |
| Immigrants | Germany | 92.1 /100 | #131 | Exceptional 17.0% |
| Whites/Caucasians | 92.1 /100 | #132 | Exceptional 17.0% |
| Immigrants | Jordan | 91.9 /100 | #133 | Exceptional 17.0% |
| Immigrants | Chile | 91.7 /100 | #134 | Exceptional 17.0% |
| Lebanese | 91.3 /100 | #135 | Exceptional 17.0% |
| Israelis | 91.0 /100 | #136 | Exceptional 17.0% |
| Immigrants | Norway | 90.9 /100 | #137 | Exceptional 17.0% |
| Welsh | 90.8 /100 | #138 | Exceptional 17.0% |
| French | 90.0 /100 | #139 | Excellent 17.0% |
| Chileans | 89.9 /100 | #140 | Excellent 17.0% |
| Aleuts | 89.9 /100 | #141 | Excellent 17.0% |
| Carpatho Rusyns | 89.6 /100 | #142 | Excellent 17.0% |
| British | 89.3 /100 | #143 | Excellent 17.0% |
| Immigrants | Brazil | 89.3 /100 | #144 | Excellent 17.0% |